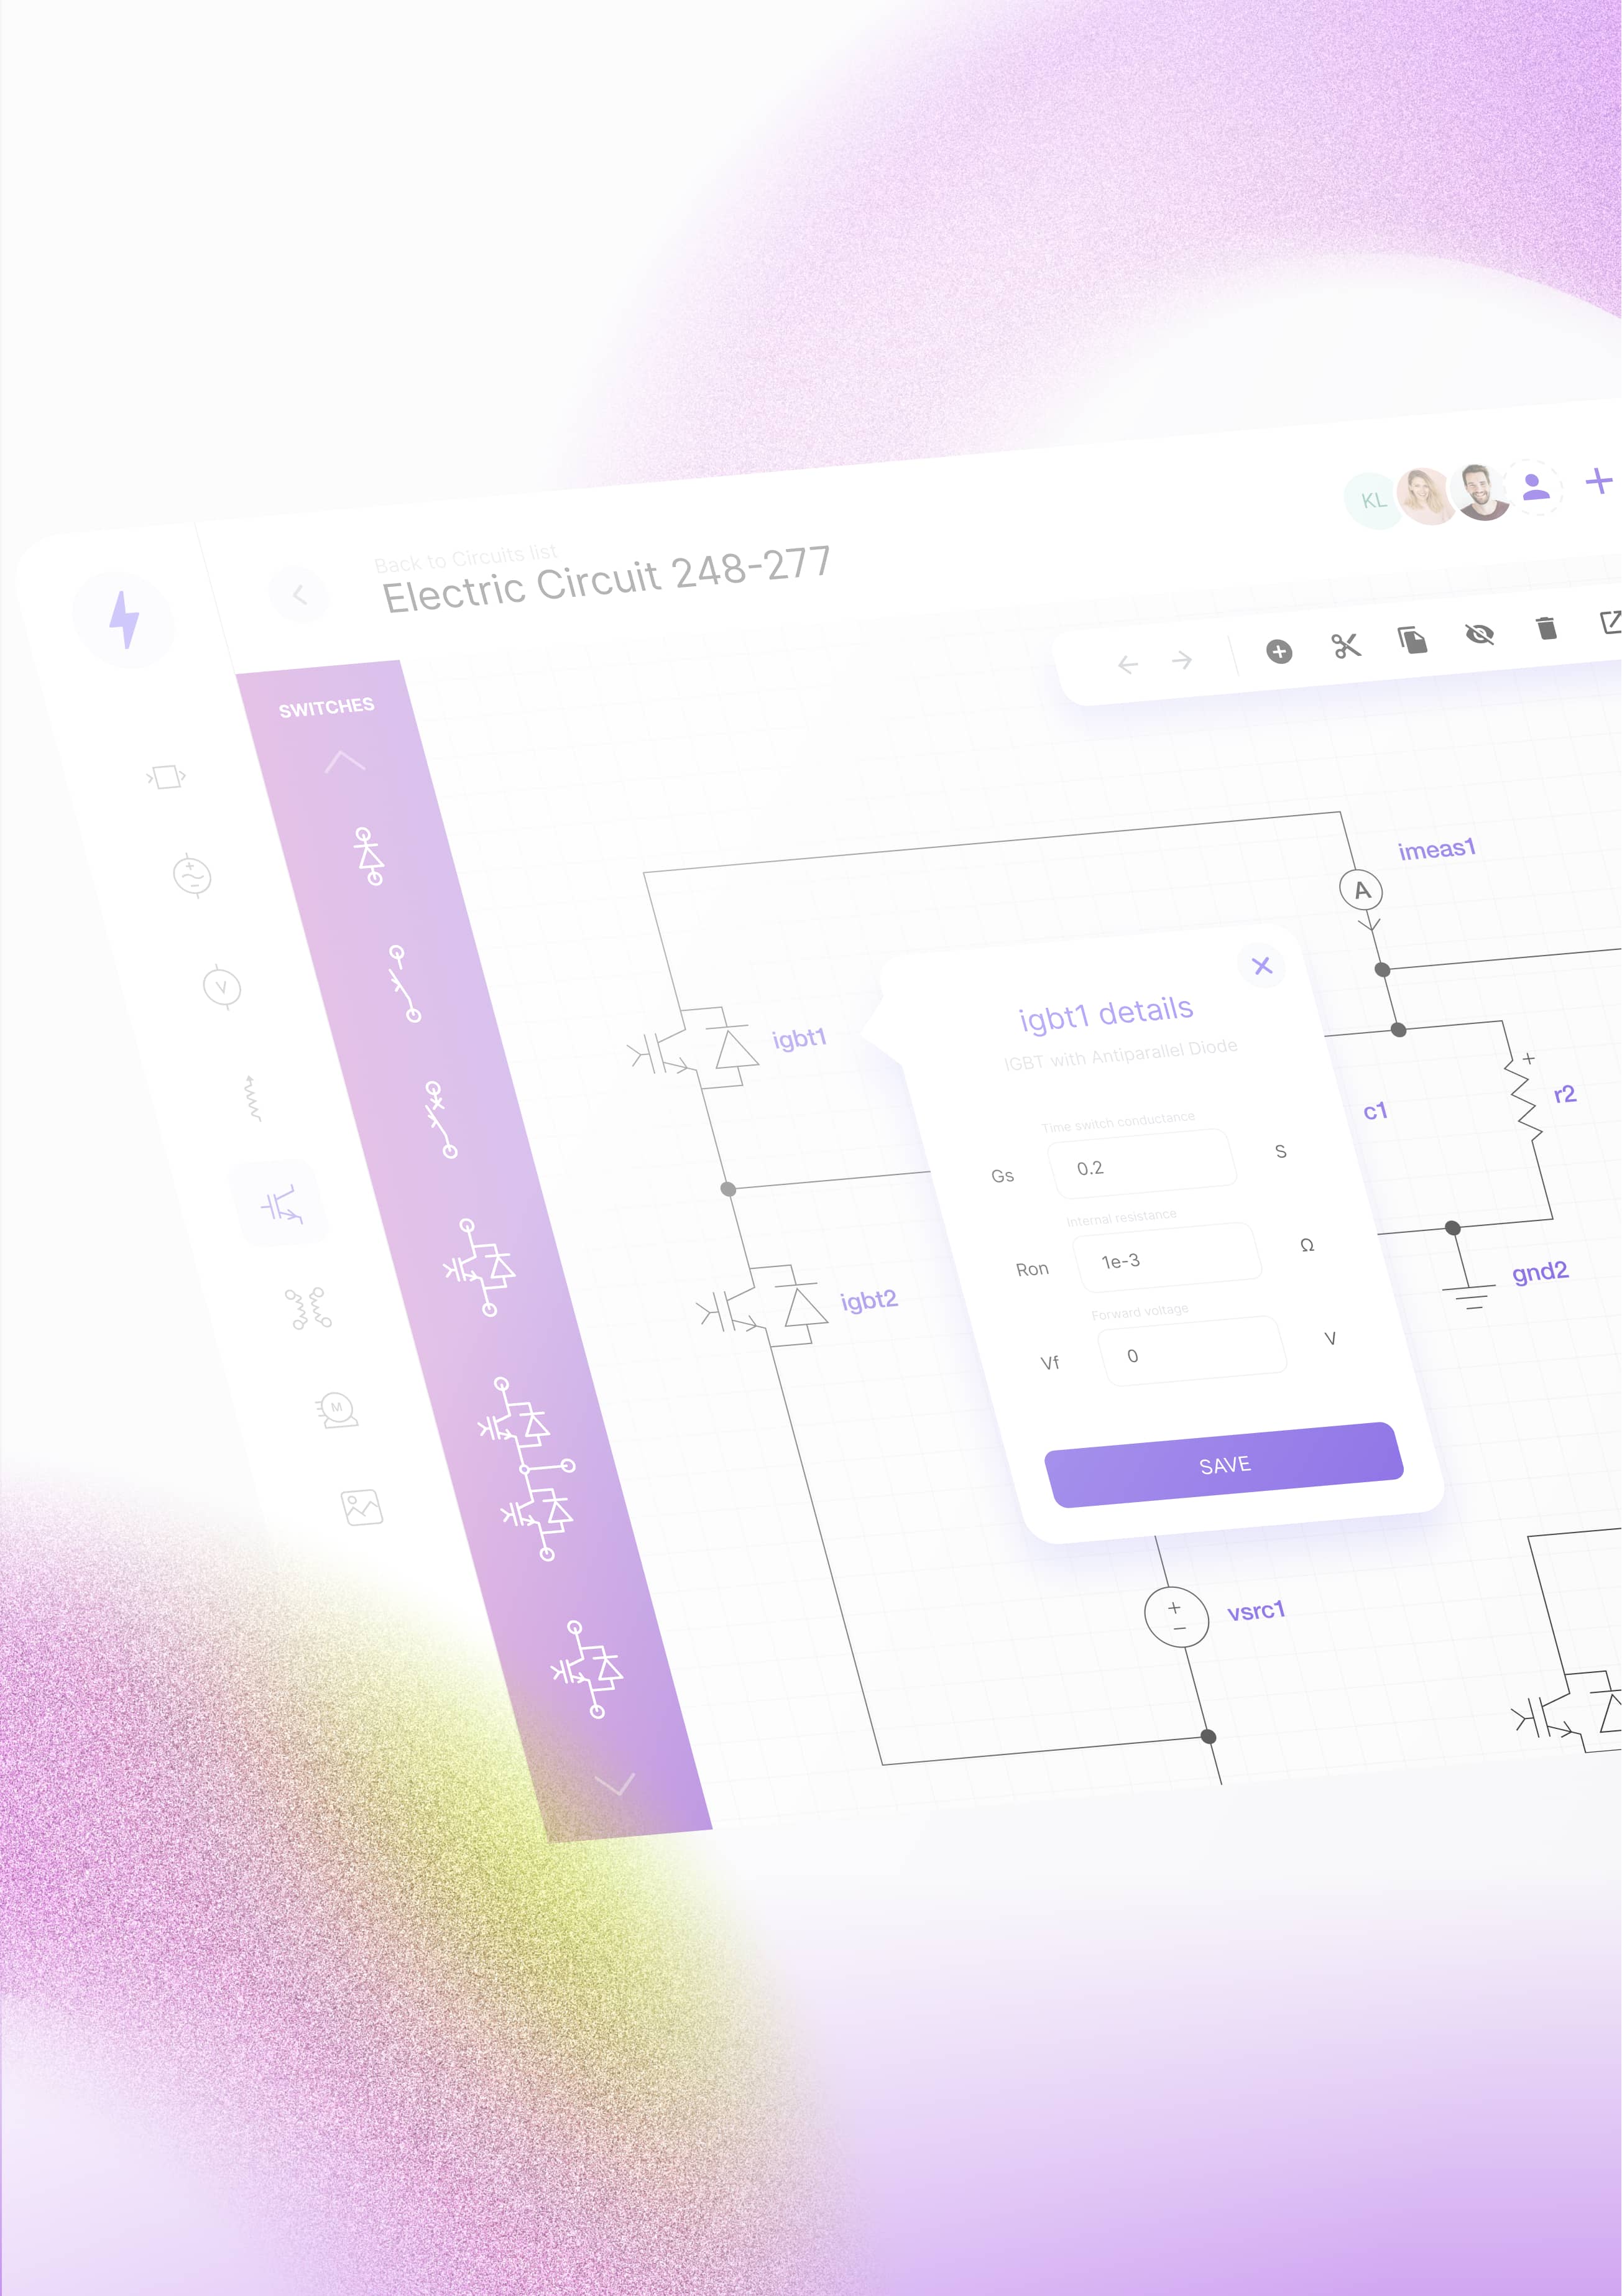
Electrical systems rarely stay exactly as designed. One field fix, one replaced component, one added subsystem, and the drawings are already out of date.
Electrical schematics, Single Line Diagrams, and wiring diagrams often no longer match the installation they describe.
This checklist takes 10 minutes. It gives you a score across five critical areas and shows exactly which gaps are most likely to cause the next commissioning delay, safety incident, or troubleshooting dead-end โ before it happens.
For each question, mark Yes (0 points), Partially (1 point), or No (2 points). Add up your total at the end.
These five areas build on each other. Sections 1-2 assess whether your diagrams are accurate and current. Sections 3-5 address the next level: can your system automate updates, integrate live data, and scale as complexity grows?
Diagram accuracy and system alignment
Electrical systems change during commissioning, field maintenance, and expansion. The diagrams rarely keep up. This section helps you spot where your electrical system design documentation has fallen out of sync with the installed system and how that's affecting troubleshooting, safety, and day-to-day operations.
Change management and update speed
A single spec change can set off a chain reaction. Diagrams need updating, component lists change, and documentation has to be rechecked. The difference between manual vs digital workflows becomes obvious here.
Automated diagram generation and maintenance
Electrical systems change constantly, but diagrams are often generated manually from stale data or trapped in disconnected files. This section looks at whether your diagrams are generated automatically from a single source of truth โ and whether that source stays current as your system evolves.
Usability and operator/engineer autonomy
Your most accurate diagram is useless if the engineer on site can't open it, can't trust it, and can't change it without filing a ticket. This section checks who actually controls your documentation โ and who's locked out.
Scalability and system complexity
A diagramming setup that works for one facility or a few hundred components doesn't always hold up as the system grows. More sites, more components, more people editing. Whether you're in energy, industrial automation systems, or manufacturing, this section looks at whether your tools can still keep up when complexity increases.
Your total score
Add up your points from all five sections.
Total:0pointsSystem under control
0 โ 10 points ยท System under control
Your diagrams are close to the installed system, and your team can access and update them without major obstacles. The main challenge now is keeping that standard as the system grows.
11 โ 25 points ยท Growing inefficiencies
Early warning signs are already there. Your documentation setup is creating bottlenecks you can probably name: updates that wait for one specialist, diagrams no one fully trusts, and no real-time connection to what's running on site. These aren't process failures โ they're structural limits of tools that weren't built for this level of complexity. The risk isn't a single incident. It's cumulative: each deferred update, each workaround, each version someone isn't sure about. Industry data shows teams in this range lose roughly 30% of project time to rework. That's before a commissioning delay or a field safety event changes the calculation entirely.
26 โ 50 points ยท High operational risk
This is where unplanned downtime starts. Your schematics have become a liability โ not an asset. Diagrams don't match your engineering data; every change means manual redrawing and delays, updates get deprioritized because only specialists can make them, and version control has broken down. Commissioning takes longer. Troubleshooting takes longer. Scaling to new sites becomes a documentation nightmare.
Score updates automatically as you fill in the five sections above.
Your score reveals where your documentation infrastructure is breaking down. Use these results to understand what to fix first.
If you're in the green, your documentation is working โ for now. The question is whether your current setup will hold as the system grows in complexity, headcount, or number of sites.
If you're in the yellow or red range, the issue rarely comes from a single bad tool or one update that got missed. It comes from a setup that was built for a simpler system โ and never caught up. Diagrams drifted from the installed reality. Changes stacked up faster than anyone could process them. And the people closest to the system lost the ability to update documentation themselves.
Your score reveals where your documentation infrastructure is breaking down.
Use these results to understand what to fix first.
If two or more sections scored 6 or above, the issues are interconnected โ and that's typically when a structural conversation about your documentation setup makes the most sense.
What closes that gap is a different approach โ one where diagrams generate automatically from engineering data, update when specs change, connect to live system values, and stay accessible to the people who actually need them.
That's what Synergy Codes builds. Custom electrical design platforms for engineering teams whose documentation needs have outgrown what off-the-shelf tools can handle โ without the extended timeline and resource drain of building it in-house.
We've built for power plant operators, BESS installations, OEM manufacturers, and industrial automation environments. The problems are usually variations of the same pattern. The solution isn't a rigid product. Proven building blocks, battle-tested across electrical systems, combine into the exact platform your team needs.
If that sounds familiar, we're happy to talk through your situation.
They're very good at capturing our needs โ and proposing better ideas where they're able to.