

Dynamic diagramming for complex corporate structures
Kuberno needed a solution to visualize and manage intricate entity relationships. We delivered a complex diagramming tool that combines advanced filtering, conditional formatting, and high-performance rendering.
The goal: simplify corporate governance by enabling users to expand, filter, and customize diagrams on the fly.
Kuberno, a global provider of enterprise entity data for legal, finance, tax, and HR teams.

A powerful, interactive entity visualisation solution capable of handling large datasets, applying user-defined styling rules, and integrating with existing systems.
Angular-based Web Component for easy integration with Kuberno’s Blazor Server environment. GoJS diagramming engine for high performance and advanced layout algorithms for large-scale corporate structures. Custom filters & formatting.
Building an intuitive, real-time structure chart tool
Creating a dynamic way to show relationships between entities wasn’t straightforward.
Here’s what we had to tackle:

Large, complex diagrams
Kuberno needed a system that could display hundreds of nodes without slowing down or overwhelming users.

Easy filtering and conditional formatting
People wanted to color-code or restyle nodes based on specific data—like changing shapes or fonts when certain conditions were met.

Branch expand/collapse
Users needed a quick way to hide or reveal entire sections of the chart, letting them focus on what mattered most.

Flawless integration with existing tech
Since Kuberno uses Blazor Server, the solution delivered had to function as a Web Component, slotting neatly into their current environment.

High performance under heavy loads
Even with multiple filters and style rules, the tool had to stay responsive, especially when dealing with large data sets.

User-friendly for everyone
Both non-technical staff and governance experts needed an interface that was easy to grasp but still offered powerful customization options.
From concept to a dynamic structure chart application
We kicked off by understanding Kuberno’s goals, diagramming needs, and integration requirements. Early workshops and research sessions helped us clarify the scope and user expectations.
Next, we mapped out a scalable front-end architecture using Angular and GoJS. We also developed initial wireframes and design mockups, focusing on performance, filtering capabilities, and user-friendly customisation options.
With the architecture in place, our team built the core features—conditional formatting, branch expand/collapse, and advanced filtering. Throughout development, we optimized for speed and responsiveness so that the solution can handle large data sets.
Finally, we wrapped the application as a Web Component for deployment in Kuberno’s Blazor Server environment. After thorough testing and feedback rounds, we fine-tuned the interface and delivered a future-ready tool.
Block 1: Advanced diagramming features
To help Kuberno surpass the limitations of static charts, the project’s core goal was to introduce a set of powerful functionalities that make corporate structures truly interactive and insightful:
Expand/collapse branches
Users can reveal or hide entire segments of the chart, making it easier to navigate complex hierarchies without getting lost. So users can focus on specific areas of interest without being overwhelmed by the full structure.

Conditional formatting
Custom rules let Kuberno color-code, reshape, or style nodes based on attributes – such as entity status or ownership percentage – so critical details stand out immediately. Vital information is visually prioritized to accelerate decision-making and improve accuracy.

Flexible filters
Users define which attributes matter most, and the tool instantly redraws the diagram to focus on relevant data only, keeping it uncluttered and clear. Rapid adjustments based on evolving data needs and user preferences ensure the display remains relevant at all times.

Block 2: Revamped design
The created solution gathers key information for Kuberno’s governance teams, offering real-time insights and instant control over complex structures:

- Centralized overview
Key metrics – such as node statuses and ownership breakdowns – are consolidated in one place, giving stakeholders a snapshot of the entire structure at a glance. A unified view enables quick assessments and more informed strategic decisions. - On-the-fly updates
Changes to filters, formatting rules, or displayed attributes occur instantly, allowing users to refine data and see results straight away. Real-time responsiveness guarantees that the dashboard always reflects the most current state of the group structure. - PDF export & reporting
Users can export a finalized chart with all applied styles intact, eliminating the hassle of manually recreating or editing diagrams in another tool. An export feature that simplifies reporting helps distribute consistent, professional visuals across teams.
Block 3: A new structure chart with a fresh design system and contextual navigation
1. Unified platform
Consistent styles, color palettes, and typography make sure every part of the chart looks and feels like a natural extension of Kube, Kuberno’s platform. A uniform design enhances usability while reducing the time needed for future updates and maintenance.

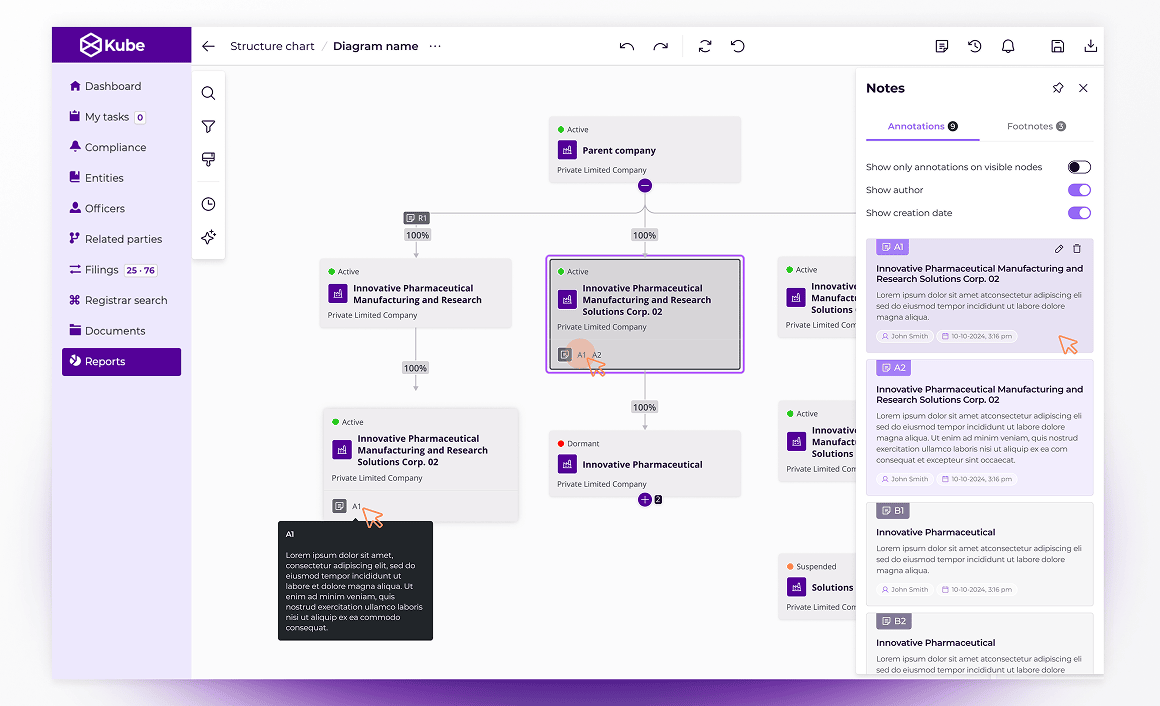
2. Node descriptions & contextual details
Each node displays key attributes—such as legal status, country, or responsible owner—so governance teams understand each entity at a glance. Contextual details integrated directly on the nodes streamline data interpretation and improve clarity.
3. Drag-and-drop
A right-click menu and intuitive drag-and-drop interface allow users to reposition or adjust nodes with minimal effort, making structure edits more fluid. Interactive features simplify complex modifications and enable users to tailor diagrams quickly.

4. Performance-driven architecture
Angular and GoJS power the solution to remain responsive even when handling hundreds of nodes, ensuring smooth operation under heavy loads. A complex architecture guarantees that as data grows, fast and efficient performance is maintained without compromise.

Complex integration for next-level governance
Integrating our advanced diagramming solution with a current setup can instantly improve data management and oversight. The architecture adapts as entity structures evolve – without forcing a costly overhaul.
- Adaptable approach
Each deployment is fine-tuned to an infrastructure, allowing fluid data exchange and minimal extra overhead. - Low-impact rollout
An iterative release strategy introduces new features without pausing essential operations, so productivity remains high. - Tailored connectivity
Specialized endpoints and data formats are accommodated, making the solution an organic part of a tech stack. - Built for expansion
As a corporate network scales, the resilient architecture maintains top-tier performance under heavier loads.
Discover the impact of an interactive structure chart

A fully customizable diagram allows governance teams to see ownership structures and relationships at a glance, reducing confusion and speeding up evaluations.

Real-time data updates and on-the-fly filtering ensure that users work with current information—helping them act swiftly and confidently.

Built-in features like conditional formatting and PDF export make it easier to maintain regulatory standards, audit trails, and consistent reporting.
Elevate your entity governance today
Share your project details, and we’ll build a dynamic diagramming solution tailored to your specific needs – ensuring a better and smarter approach to corporate oversight.