Shaping the future of data visualization

Explore cutting-edge ideas, case studies, and expert perspectives on designing visual solutions and leveraging AI for smarter decision-making.

An abstract visual showing the dissolving purpure and lime gradient-colored element.
Hand-drawn flowchart transformed into a polished digital version.
Generate editable diagrams from pictures or screenshots

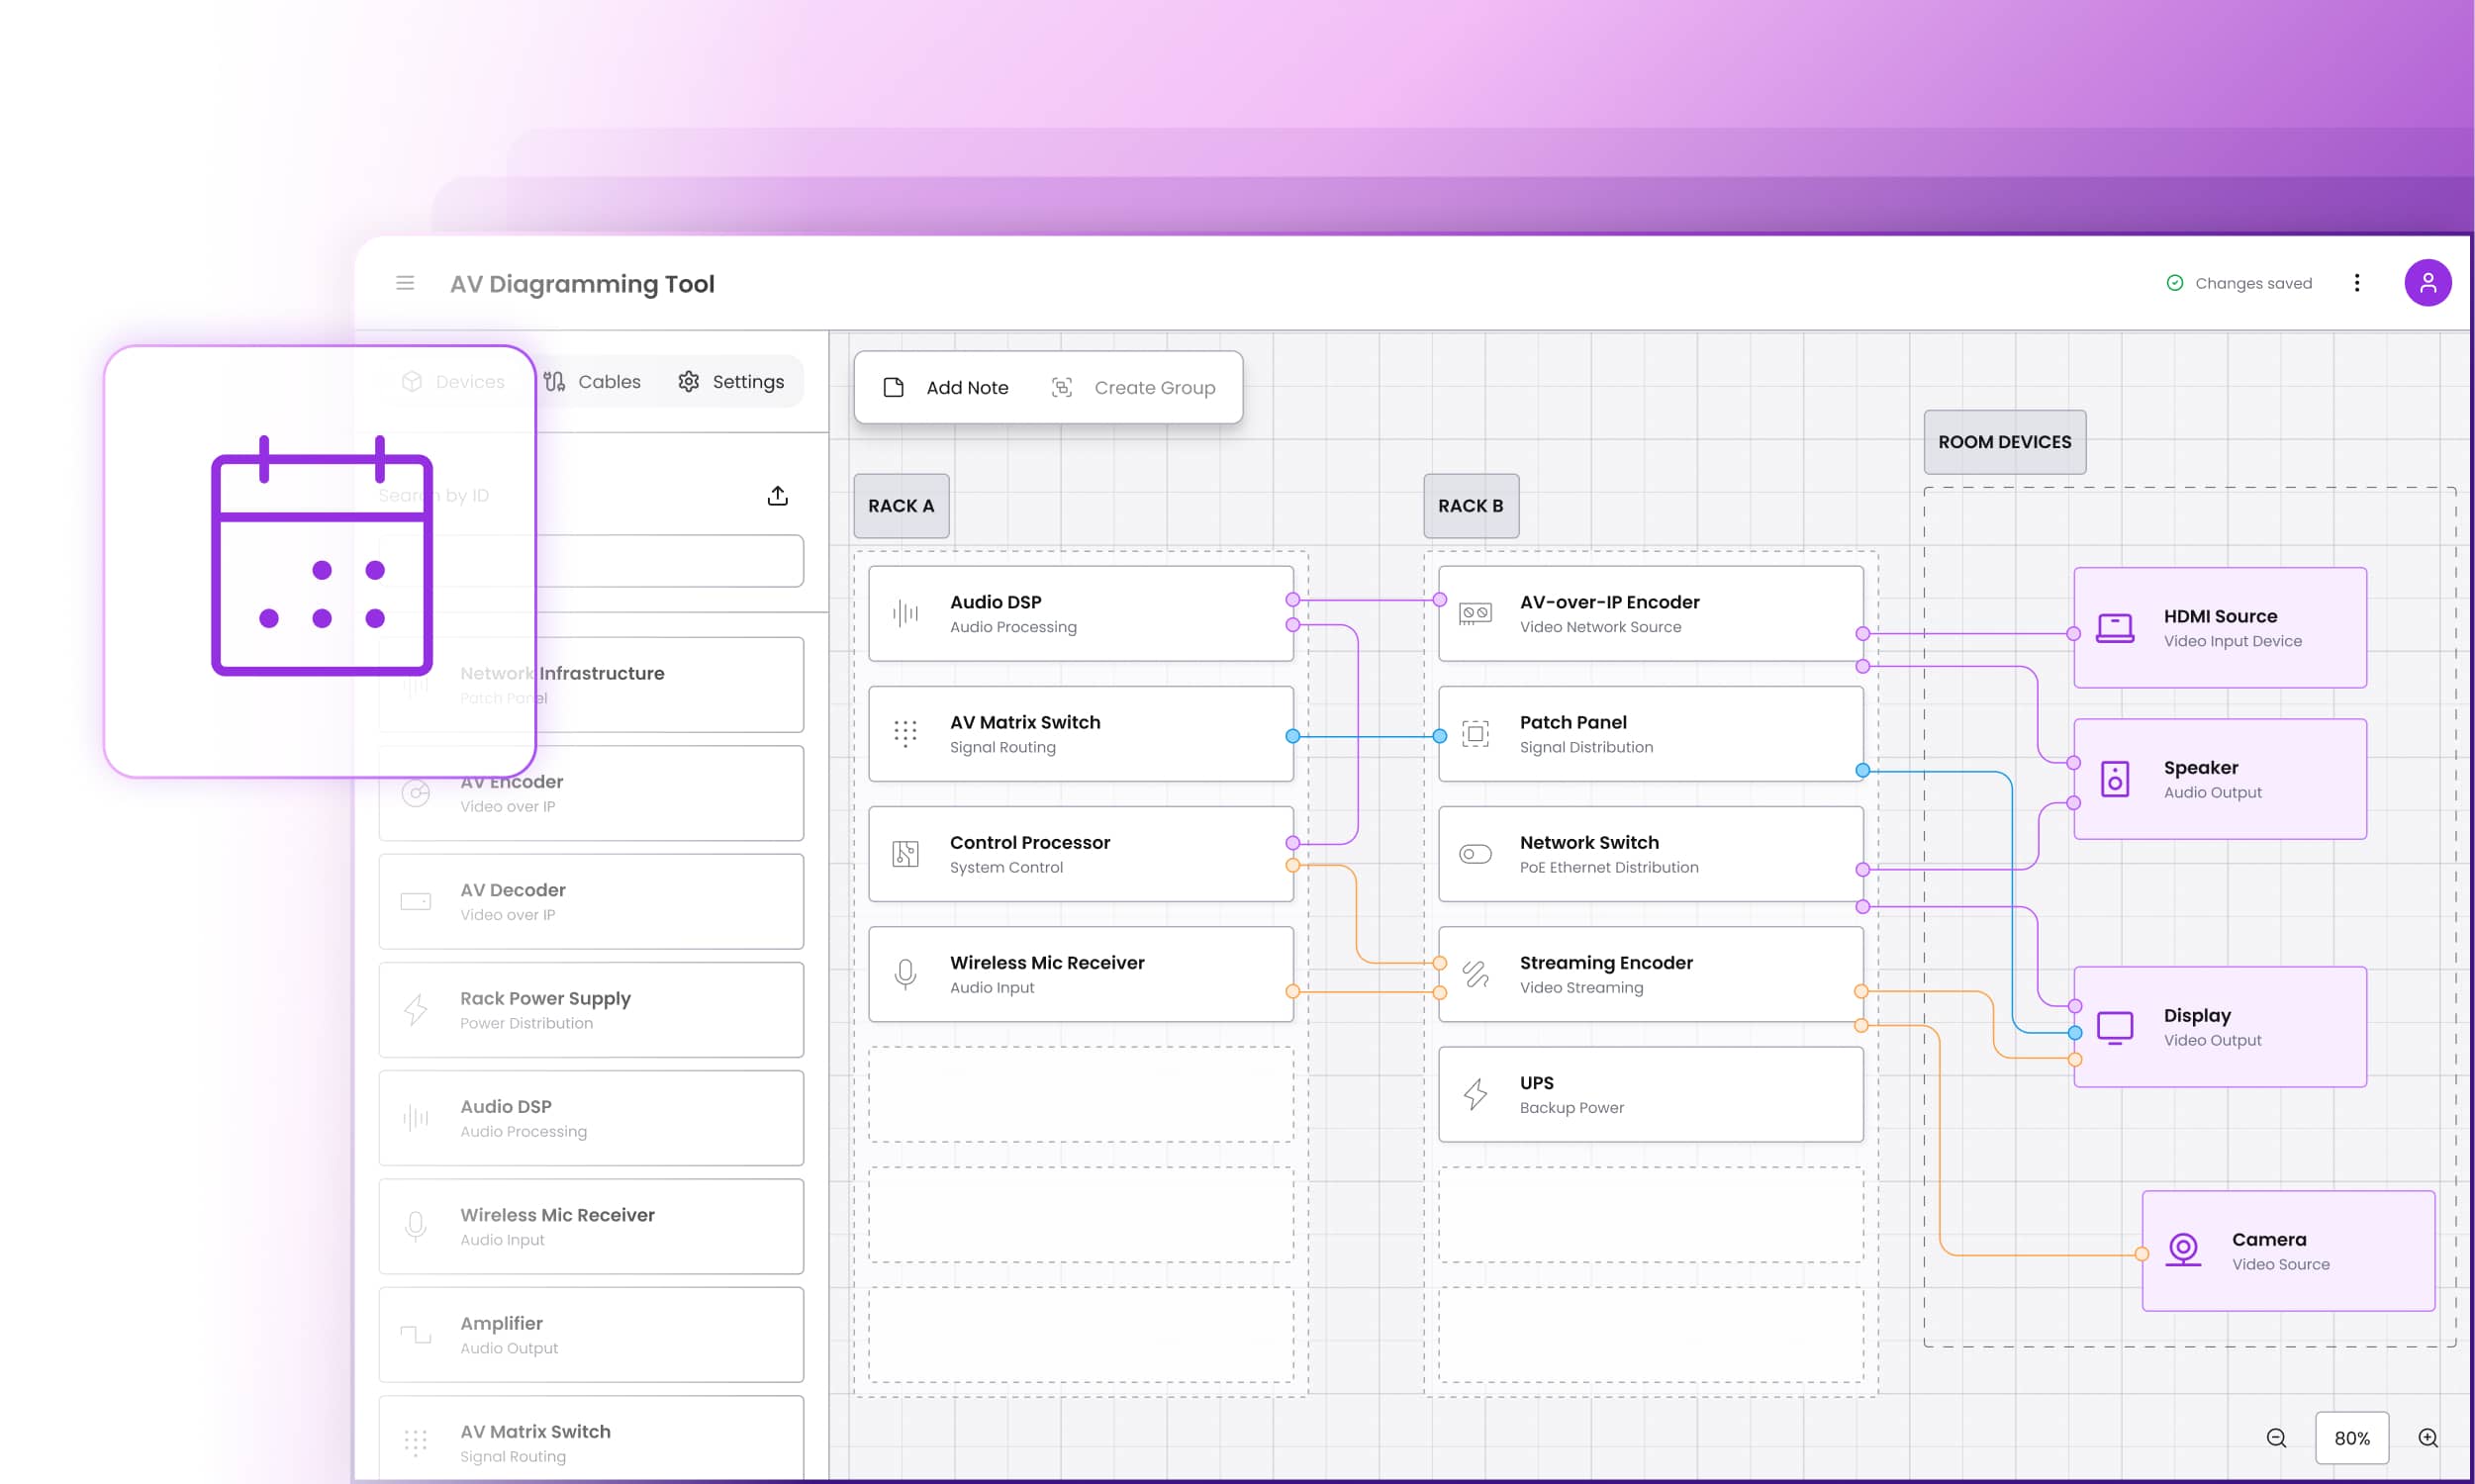
Convert any hand-drawn flowchart, whiteboard sketch, or screenshot of a diagram into a digital, editable format.

The artwork depicts an abstract design with large, curved shapes in gradient colors ranging from purple to yellow. The background is dark, and the shapes seem to overlap, creating a sense of depth and movement.
Featured
All articles

Top 10 free graph visualization software to simplify complex data

Let’s explore the best graph visualization tools available for free, including open-source solutions and graph database visualization platforms.

Ida Ożarowska
Dec 1, 2025

What is a call flow? Best practices, types, and examples

Master call flows for seamless customer interactions! Learn best practices, types, and tools to elevate experiences and boost efficiency.

Weronika Pietrucha
Nov 28, 2025

Real-time data visualization: Examples and best practices

Real-time data visualization transforms raw data into actionable insights instantly – discover how it can revolutionize your operations today.

Ida Ożarowska
Nov 26, 2025

The best AI tools for data visualization to consider in 2026

This guide explores the best AI data visualization tools in 2026, breaking down their benefits, features, and ideal use cases. Find the right fit!

Ida Ożarowska
Nov 26, 2025

Ultimate guide to piping and instrumentation diagram software

You’ll learn how P&ID software improves accuracy, collaboration and compliance, and why custom solutions offer better fit, faster delivery, and long-term value.

Ida Ożarowska
Nov 24, 2025

Challenges and benefits of workflow automation

In this article you’ll find examples of real business impact, common pitfalls to avoid, and a practical look at what modern workflow automation actually deliver

Weronika Pietrucha
Nov 20, 2025

React Flow vs. JointJS React wrapper – a practical comparison

Compare two leading diagramming libraries for React developers. Learn their trade-offs in performance, customization and accessibility.

Maciej Kaźmierczyk
Nov 18, 2025

Top 10 free graph visualization software to simplify complex data

Let’s explore the best graph visualization tools available for free, including open-source solutions and graph database visualization platforms.

Ida Ożarowska
Dec 1, 2025

What is a call flow? Best practices, types, and examples

Master call flows for seamless customer interactions! Learn best practices, types, and tools to elevate experiences and boost efficiency.

Weronika Pietrucha
Nov 28, 2025

Real-time data visualization: Examples and best practices

Real-time data visualization transforms raw data into actionable insights instantly – discover how it can revolutionize your operations today.

Ida Ożarowska
Nov 26, 2025

The best AI tools for data visualization to consider in 2026

This guide explores the best AI data visualization tools in 2026, breaking down their benefits, features, and ideal use cases. Find the right fit!

Ida Ożarowska
Nov 26, 2025

Ultimate guide to piping and instrumentation diagram software

You’ll learn how P&ID software improves accuracy, collaboration and compliance, and why custom solutions offer better fit, faster delivery, and long-term value.

Ida Ożarowska
Nov 24, 2025

Challenges and benefits of workflow automation

In this article you’ll find examples of real business impact, common pitfalls to avoid, and a practical look at what modern workflow automation actually deliver

Weronika Pietrucha
Nov 20, 2025

Chart vs table vs graph: which one to use and when?

Choosing between a graph, chart, or table can make a big difference. So, how do you pick the right one?

Ida Ożarowska
Nov 12, 2025

10 rules to make your charts and diagrams stand out

Master 10 proven rules to create clear data visualizations that transform complex information into actionable insights and drive better decisions.

Łukasz Iwaniec
Oct 29, 2025

The power of the product design process in software development

A broken UI isn't always bad design – it's often a missing process. Discover how proper product design saves time, money, and frustration in development.

Joanna Pawłowska
Oct 2, 2025

Beyond GoJS vs. JointJS: Choosing the right agency for developing diagramming tools

Choosing between GoJS and JointJS depends on project needs. The right agency ensures effective implementation, delivering high-quality, tailored solutions.

Ida Ożarowska
Sep 30, 2025

10 workflow management tools: what to choose in 2025?

Read on to learn about workflow management software, the types available, and how to select the best solution.

Ida Ożarowska
Aug 19, 2025

Interactive diagrams – how dynamic visualizations simplify complex processes

Discover how interactive diagrams simplify complex data, enhance decision-making, and are built using JavaScript, GoJS, React, and Angular for dynamic visuals.

Wojciech Gąciarz
Aug 4, 2025