GoJS – easy data visualization
Discover how GoJS enables rapid creation of interactive diagrams for UML editing, process flows, and simulations, streamlining business visualizations.

Nowadays companies process a large amount of data. Therefore, there is no wonder they have trouble to get it all in order. Besides, it is more difficult to take an advantage of such data for business. How to visualize all roles and relationships in a big company? Or how to create simulation of some processes? It is all possible to achieve due to fully-fledged applications especially graphic and interactive ones which can be developed using GoJS - a library intended to interactive data visualizations.
JAVASCRIPT LIBRARY FOR DIAGRAMS
GoJS uses HTML Canvas and operates on various modern platforms and browsers. The developer gets a full set of tools aimed at providing interactivity, among others: drag'n'drop support, clipboard support, wide range of ready diagram layouts, palettes, previews, as well as support for undo and redo.
GoJS library is written without any additional dependencies - neither from external libraries, nor from server functionalities. We are not limited in any way - we can use this library to build any type of application (frontend, mobile, desktop) and use the library only for the intended purpose.
EASY DEVELOPMENT OF APPLICATIONS
The library is not free, however it provides possibilities that can save a lot of developer’s time compared to working on open-source libraries used for similar purposes, such as D3 or Fabric.js.
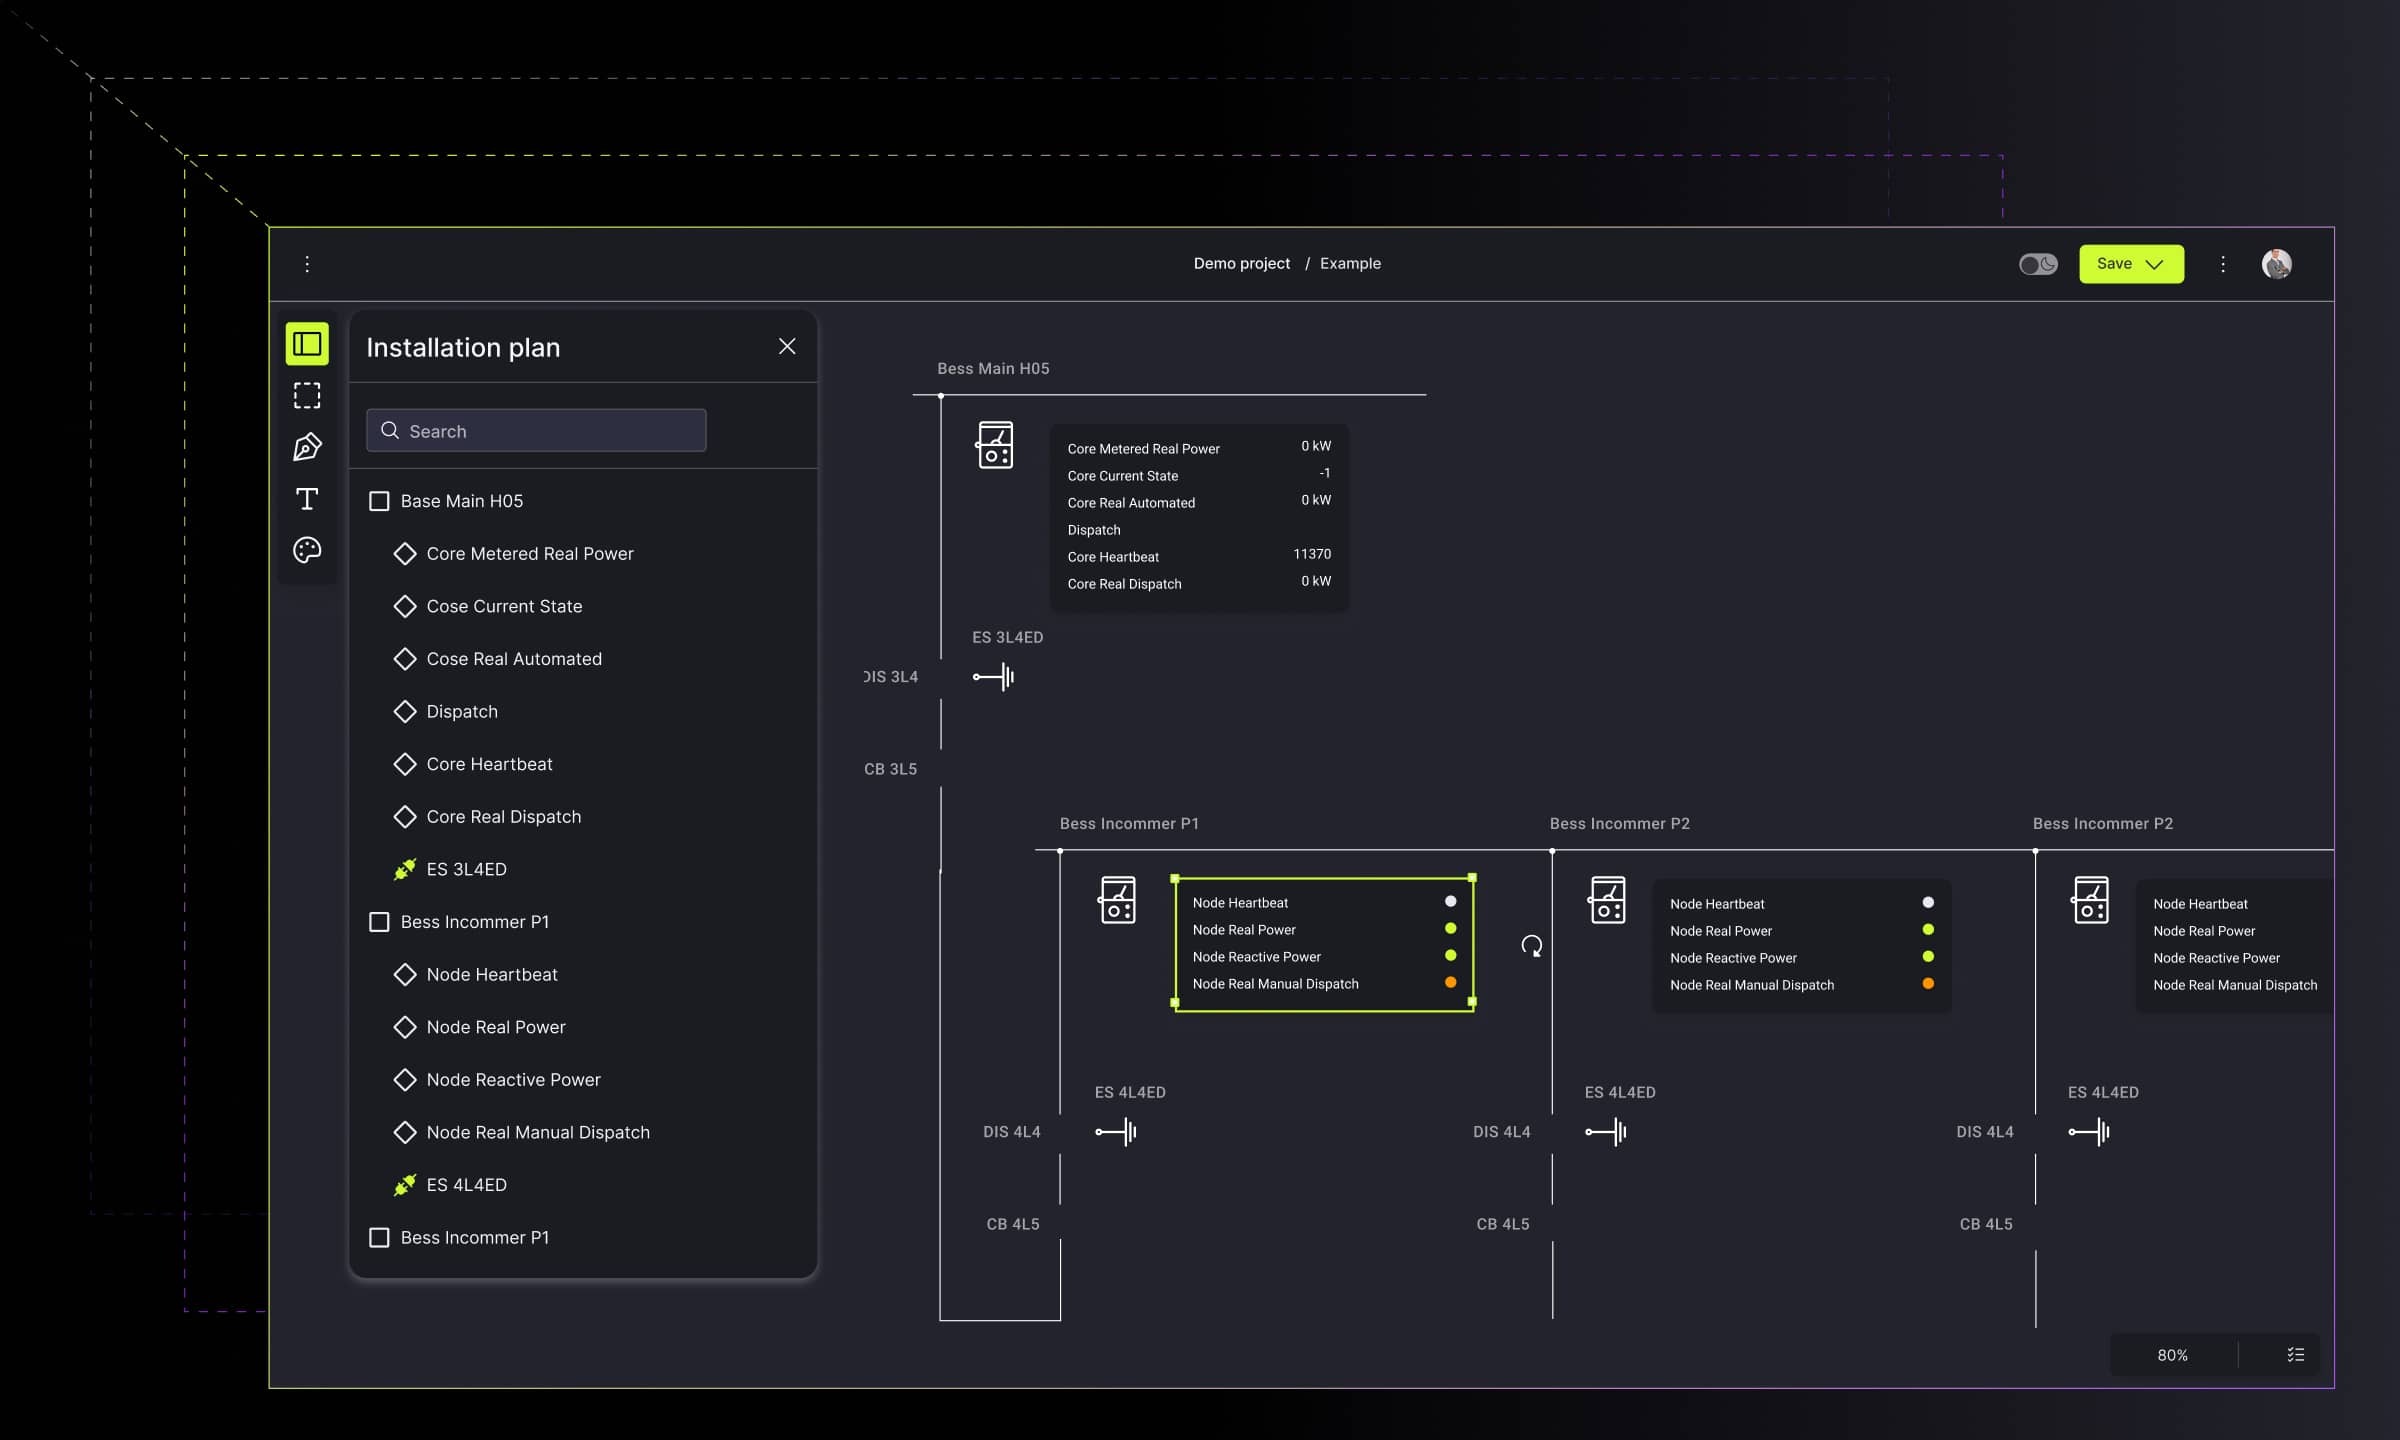
The are two main differences - the availability of full interactivity and many ready tools which shorten time of creating various types of diagrams (and not only!). This results in easier development of applications. We can simply develop e.g. presentation of process flow (data updated in real-time), UML editing, creating mind maps or designing of electronic circuits is much easier.
GOJS FOR BUSINESS
Javascript library for diagrams and visualizations will be a perfect solution for developing a simulation tool. It may be used as well for designing block/electric schemes and organizing hierarchic data.
Read more about data visualization applications.
This post was also published on Medium.
Find how we can help you enhance your software and win more deals
Contact us to discuss your project. After you submit the form, we’ll get in touch with you within 48 hours to arrange a call.


