
Giving IoT hardware a visual interface
The client manufactured IoT sensors that measure temperature, humidity, light intensity, and other machine and environmental parameters. While the devices were deployed across industrial and commercial environments, users lacked a convenient interface to easily access and assess the condition of machines and production lines.
Synergy Codes designed and prototyped an industrial IoT dashboard application built with GoJS. The project went through multiple design iterations covering catalogs, sensor data monitoring, floor plan overlays, schematics, and overview dashboards. The scope included concept development, UX/UI design, and interactive mockups.
IoT sensor manufacturer
User-facing interface for sensor management
Concept, design, UX/UI, interactive mockups
The missing link between hardware
and users

Mapping sensors to a physical space
Sensors were deployed across production sites, but without a dedicated application, users had no convenient way to visually connect the collected data with the physical layout of the facility. The interface needed to provide that crucial spatial context.

Linking sensors to specific machines
Each sensor measured specific parameters, but there was no user-facing interface to assign it to a particular machine or location on the production floor.

Supporting per-facility configuration
Every facility has different thresholds and alert requirements. Users needed a way to set from/to ranges and alert levels for each device, tailored to their specific setup.

Turning raw data into reports
Operations teams required dashboards and reports filterable by machine type, sector, and other criteria to get a structured overview of sensor data.
A configurable industrial
IoT dashboard built with GoJS
We designed a dashboard that gives users a visual way to monitor and configure sensors across the production environment.
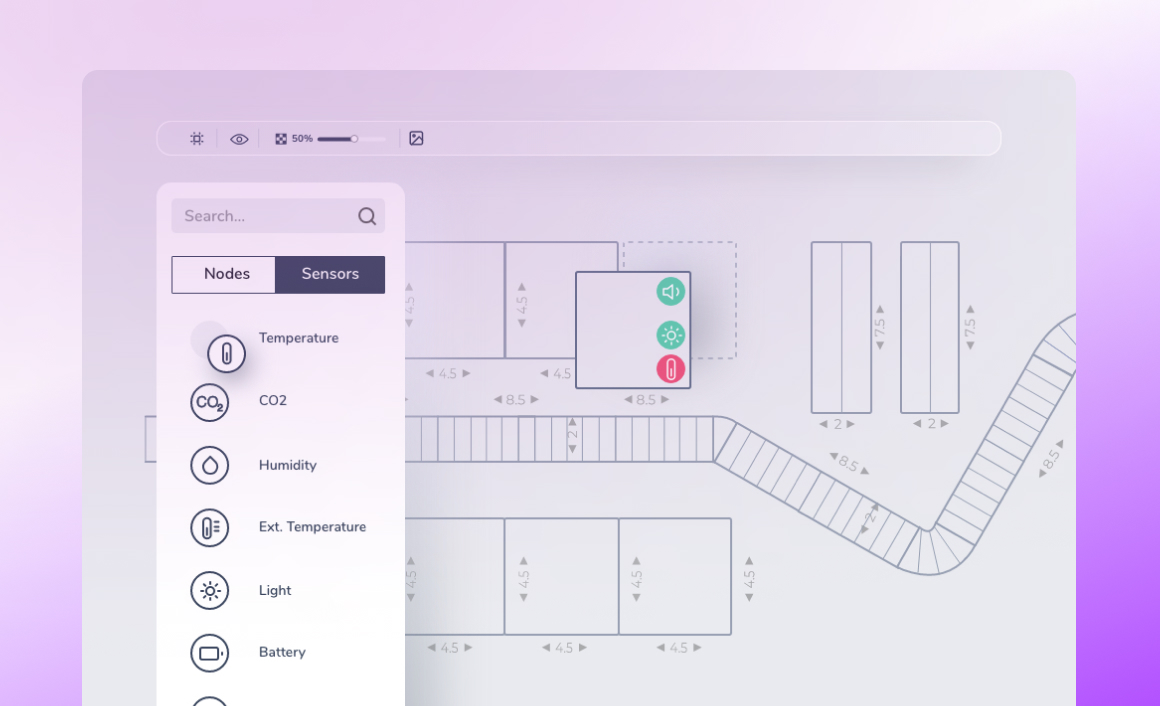
Floor plan with drag-and-drop sensor placement
The core of the application is a visual facility map built from uploaded floor plan drawings. Users place icons on the layout that represent machines on the production line. Each placed element contains information about the equipment and its function. From there, users assign IoT sensors to specific machines on the plan, so the entire production layout and its sensor coverage are visible at a glance.
We also explored additional views such as sensor catalogs, schematic diagrams, and management panels for organizing devices across the production plan.
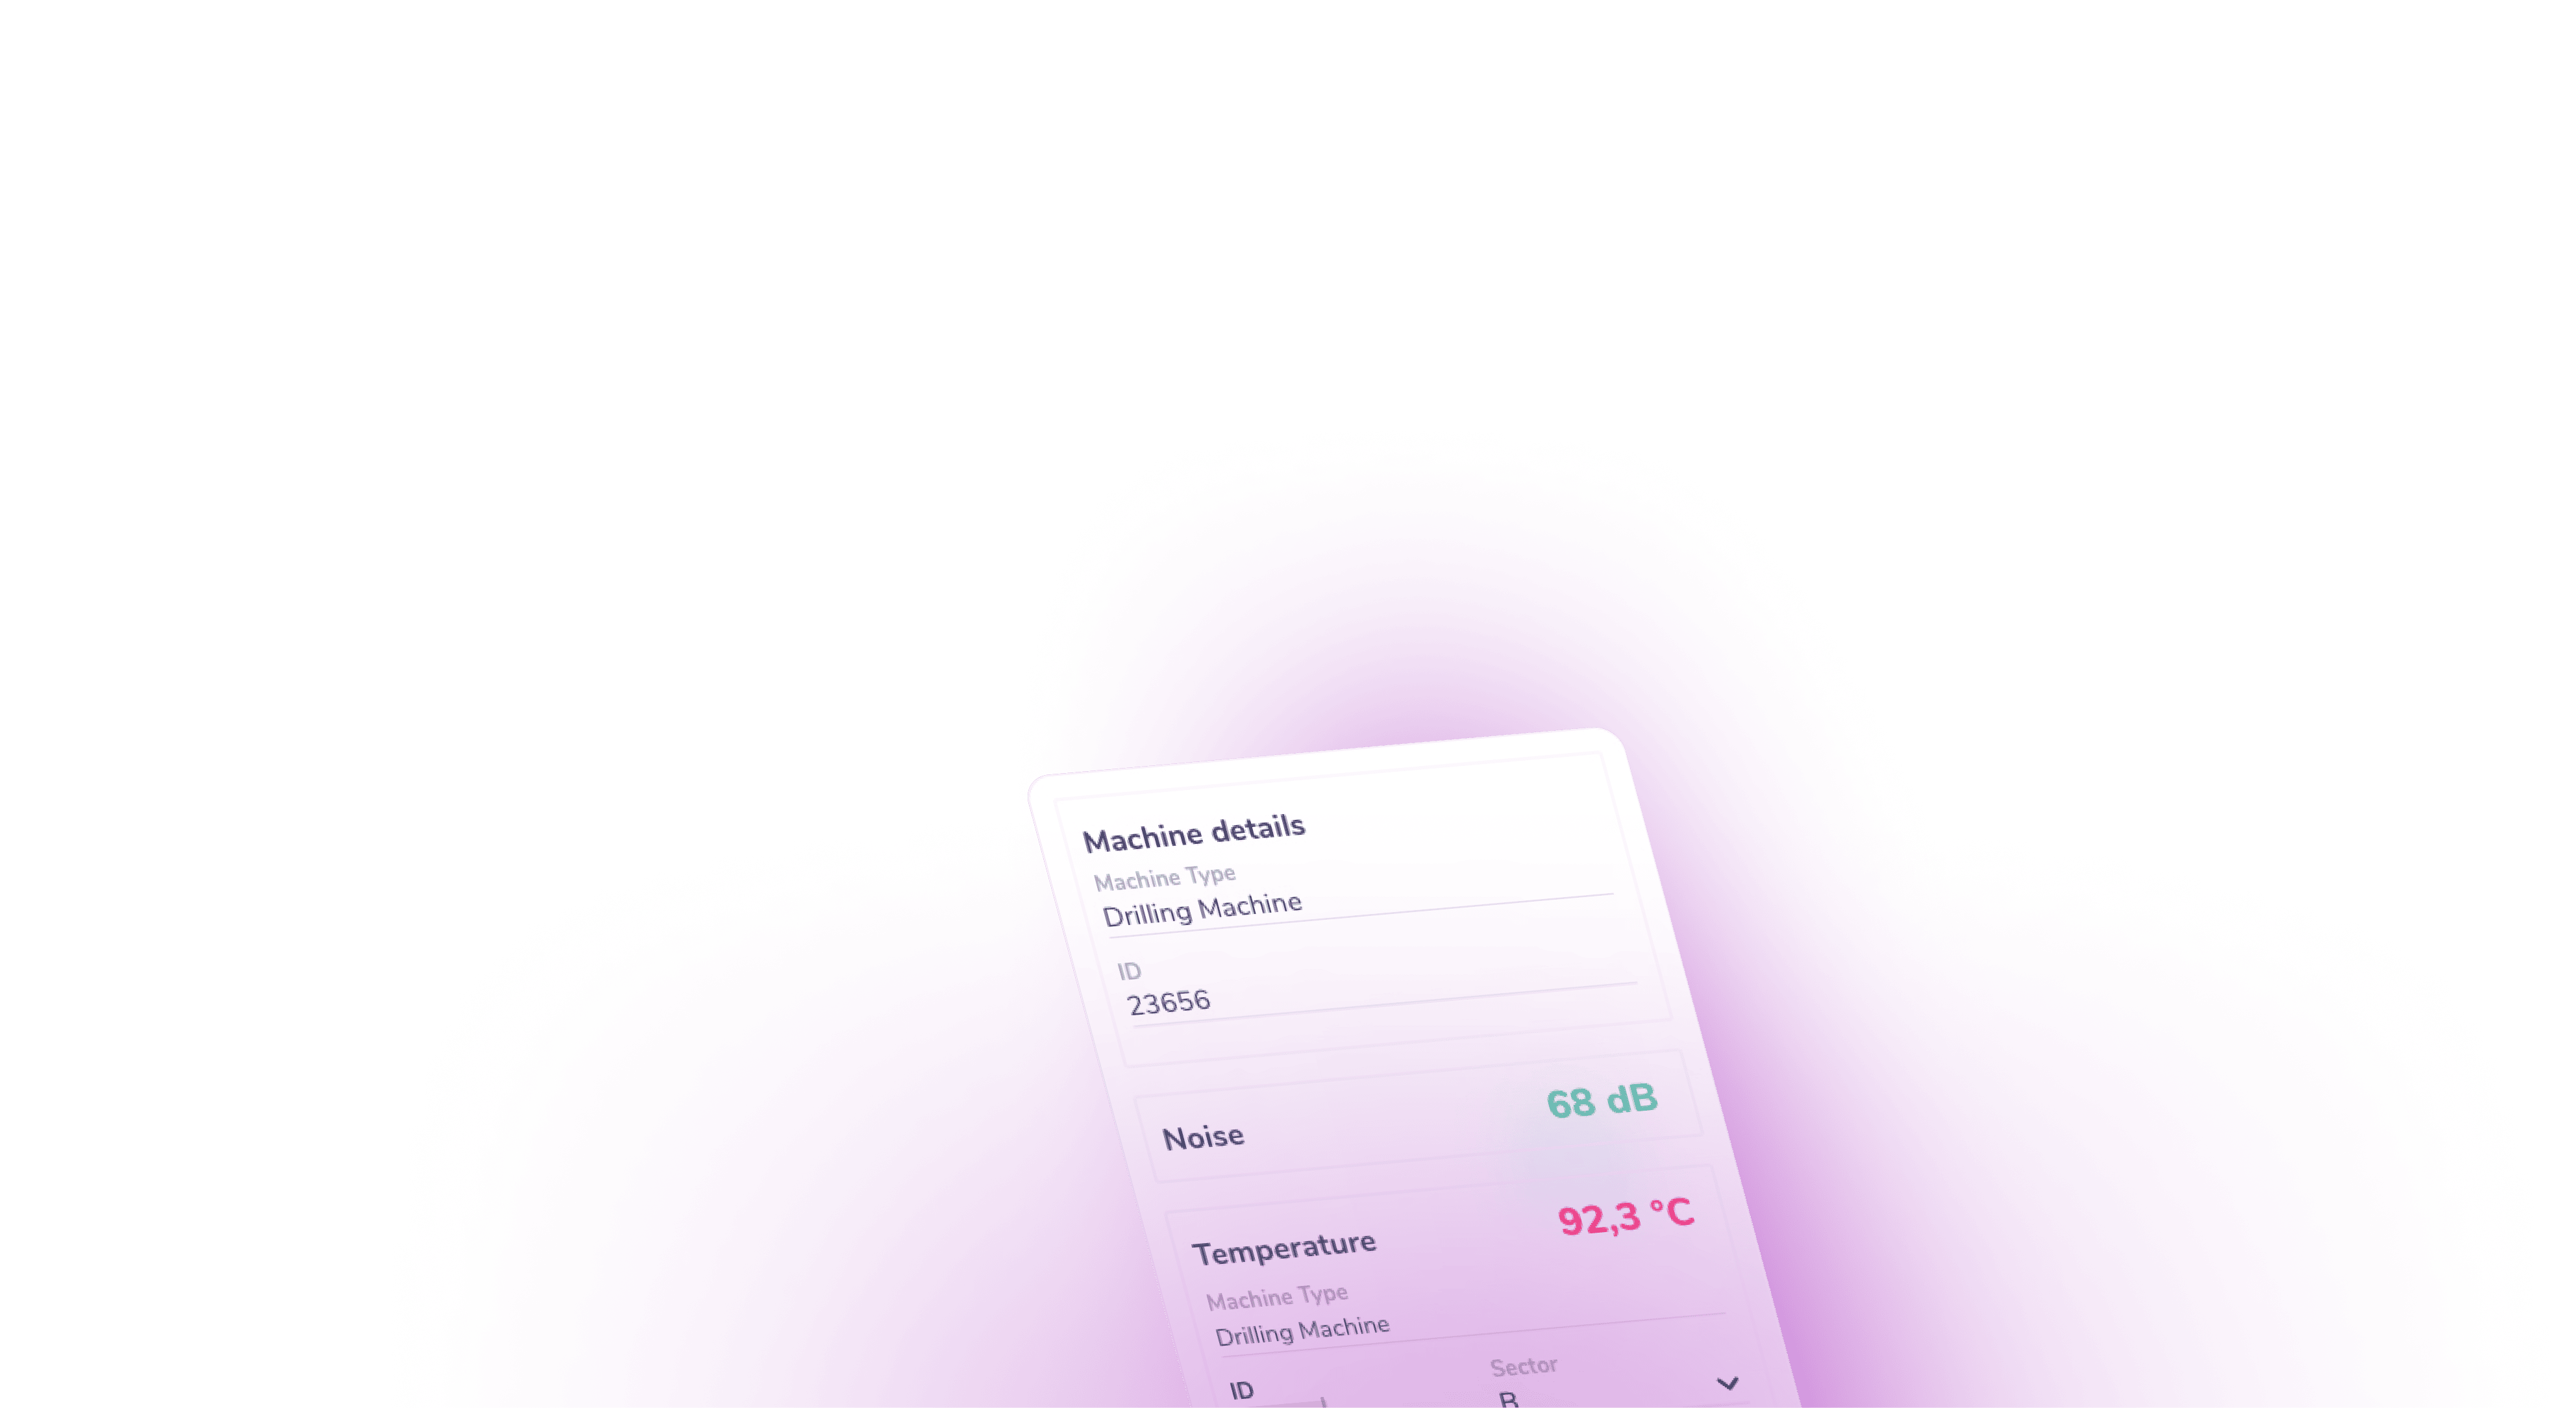
Sensor configuration and alert ranges
A configuration panel lets users set the key parameters for each sensor: location, range (from/to values), data type, and data representation. Different diagram types are available for presenting sensor data. This is what makes the IoT monitoring dashboard adaptable to different facilities and users.
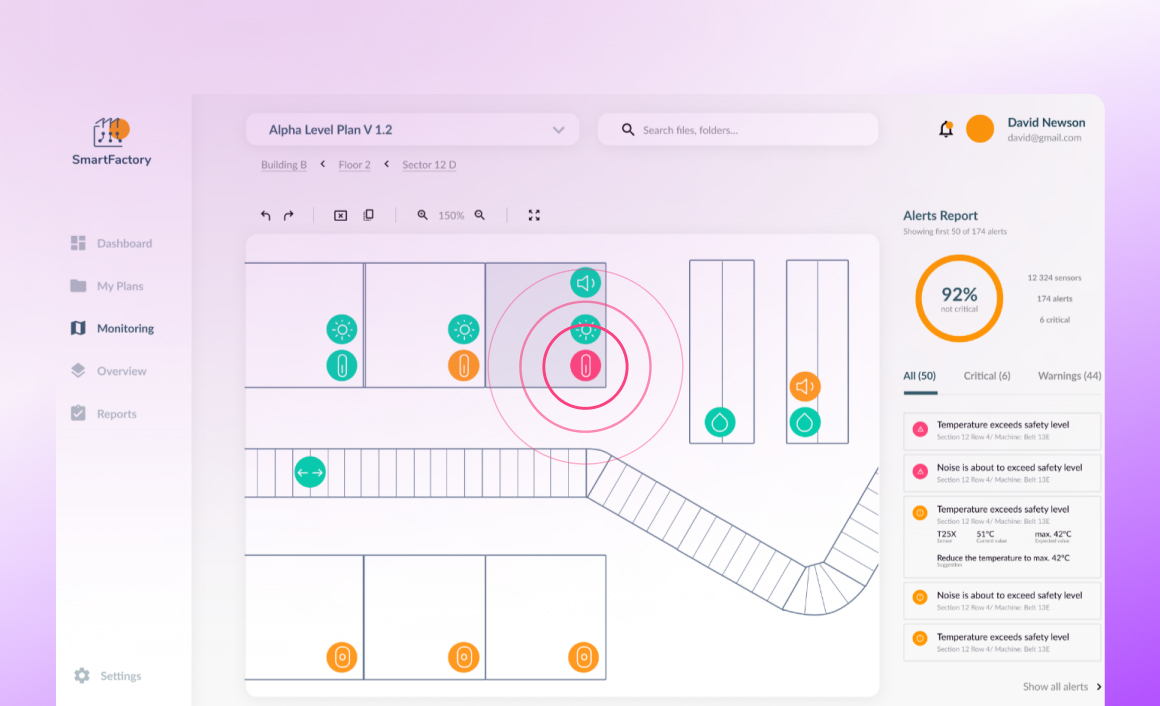
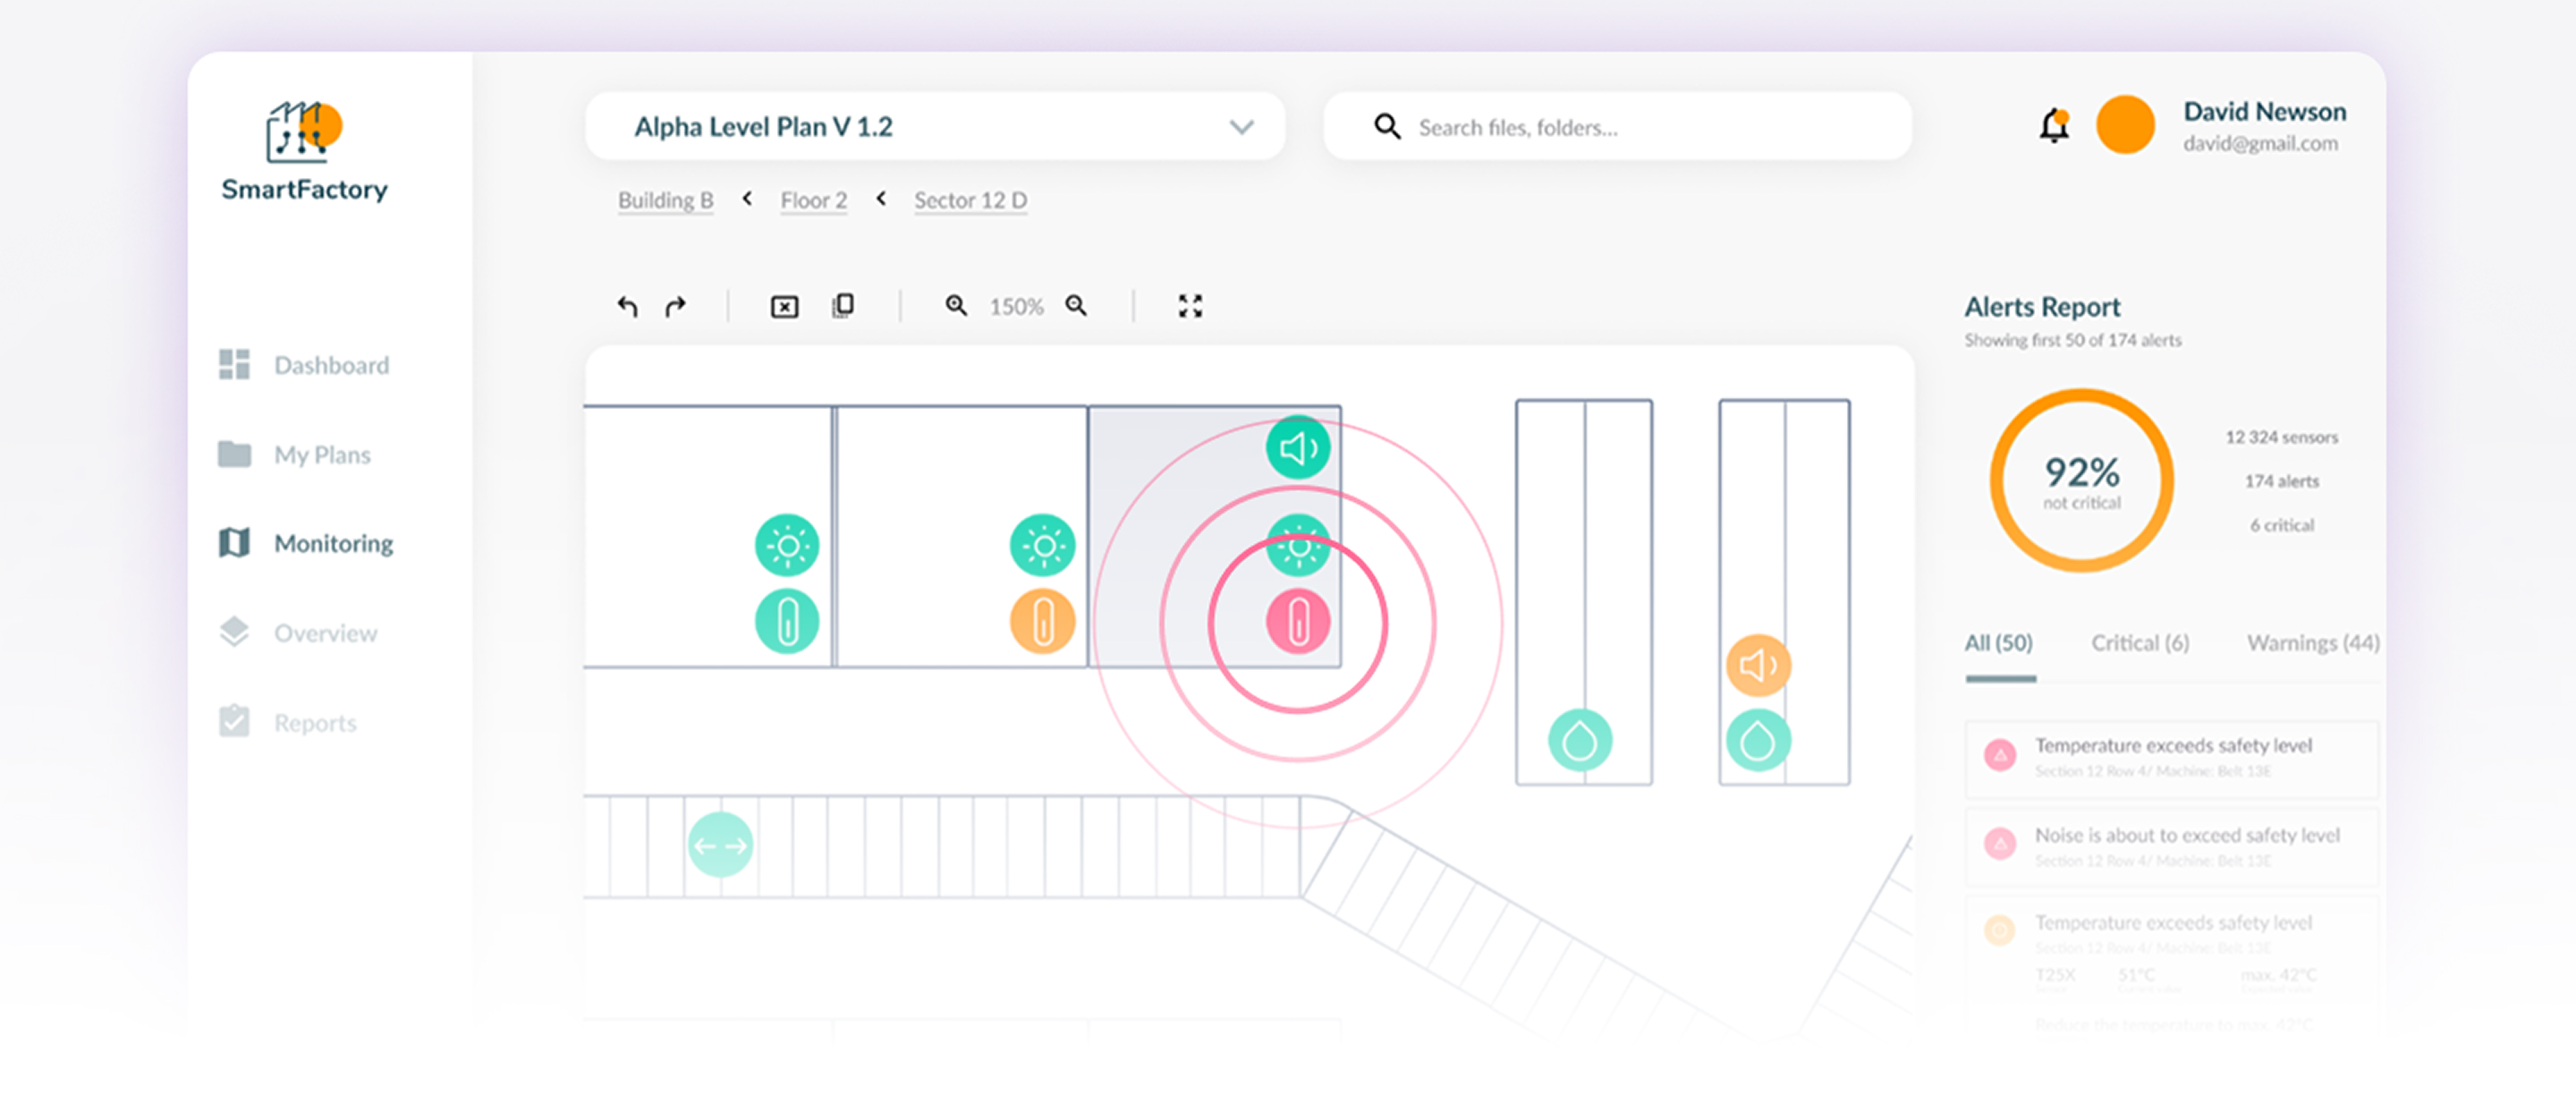
Alerting and operational monitoring
The alerting view shows how data from existing hardware and IoT sensors could feed into an interactive dashboard. When sensor readings move outside defined ranges, users receive alerts so they can address issues quickly and investigate potential problems.


Dashboards and configurable reports
The overview dashboard brings device data together in interactive diagrams. Reports can be filtered by machine type, sector, and other criteria. When connected to back-end IoT solutions, data updates automatically, giving teams an up-to-date overview of conditions across the facility.
Benefits of the industrial iot dashboards

By providing a user-friendly interface, facility teams can immediately understand where data is coming from and what part of the production line it relates to.

Sensor ranges and alert thresholds can be adjusted to match the operating conditions and requirements of a specific plant.

Instead of checking separate tools or raw data streams, teams can review sensor activity through a single dashboard that shows the current state of the production environment. over time – supporting continuous expansion without disruption.
Filtered reports help teams examine conditions across machines, sectors, or production areas and identify patterns in the collected data.
The prototype shows how a dedicated application can turn sensor data into actionable insights, giving users an intuitive interface to monitor and analyze information from the devices.
FAQ
- What does an industrial IoT dashboard include?
Industrial IoT dashboards typically include data visualizations, charts, status indicators, and alerts. They provide a user interface to monitor and analyze data collected from IoT sensors, presenting key performance indicators, system status, and operational information in a structured way.
- What are examples of industrial IoT dashboards?
Common examples include energy monitoring dashboards for tracking power consumption, predictive maintenance dashboards for monitoring machine health, supply chain dashboards for tracking inventory and logistics, and environmental monitoring dashboards for analyzing air quality, humidity, temperature, or pollution levels.
- What is an IoT dashboard platform?
An IoT dashboard platform is a software solution that enables users to collect, process, and visualize data from IoT devices. It typically offers data connectivity, customizable dashboard design, user access controls, and integration with various IoT systems.
- What is the difference between an IoT platform and an IoT dashboard?
An IoT platform is a broader solution that covers device connectivity, management, data processing, and analytics. An IoT dashboard is a specific component focused on data visualization, providing a user-friendly interface to monitor and interact with IoT data.
Move beyond limitations with a custom IoT software
Ready to move beyond the standard tools? Team up with seasoned developers to deliver
IoT software perfectly aligned with your processes.