4 unobvious uses of real-time data in diagrams
Discover how real-time data in diagrams boosts monitoring, reporting, quick responses, and collaboration, enhancing decision-making and project efficiency.

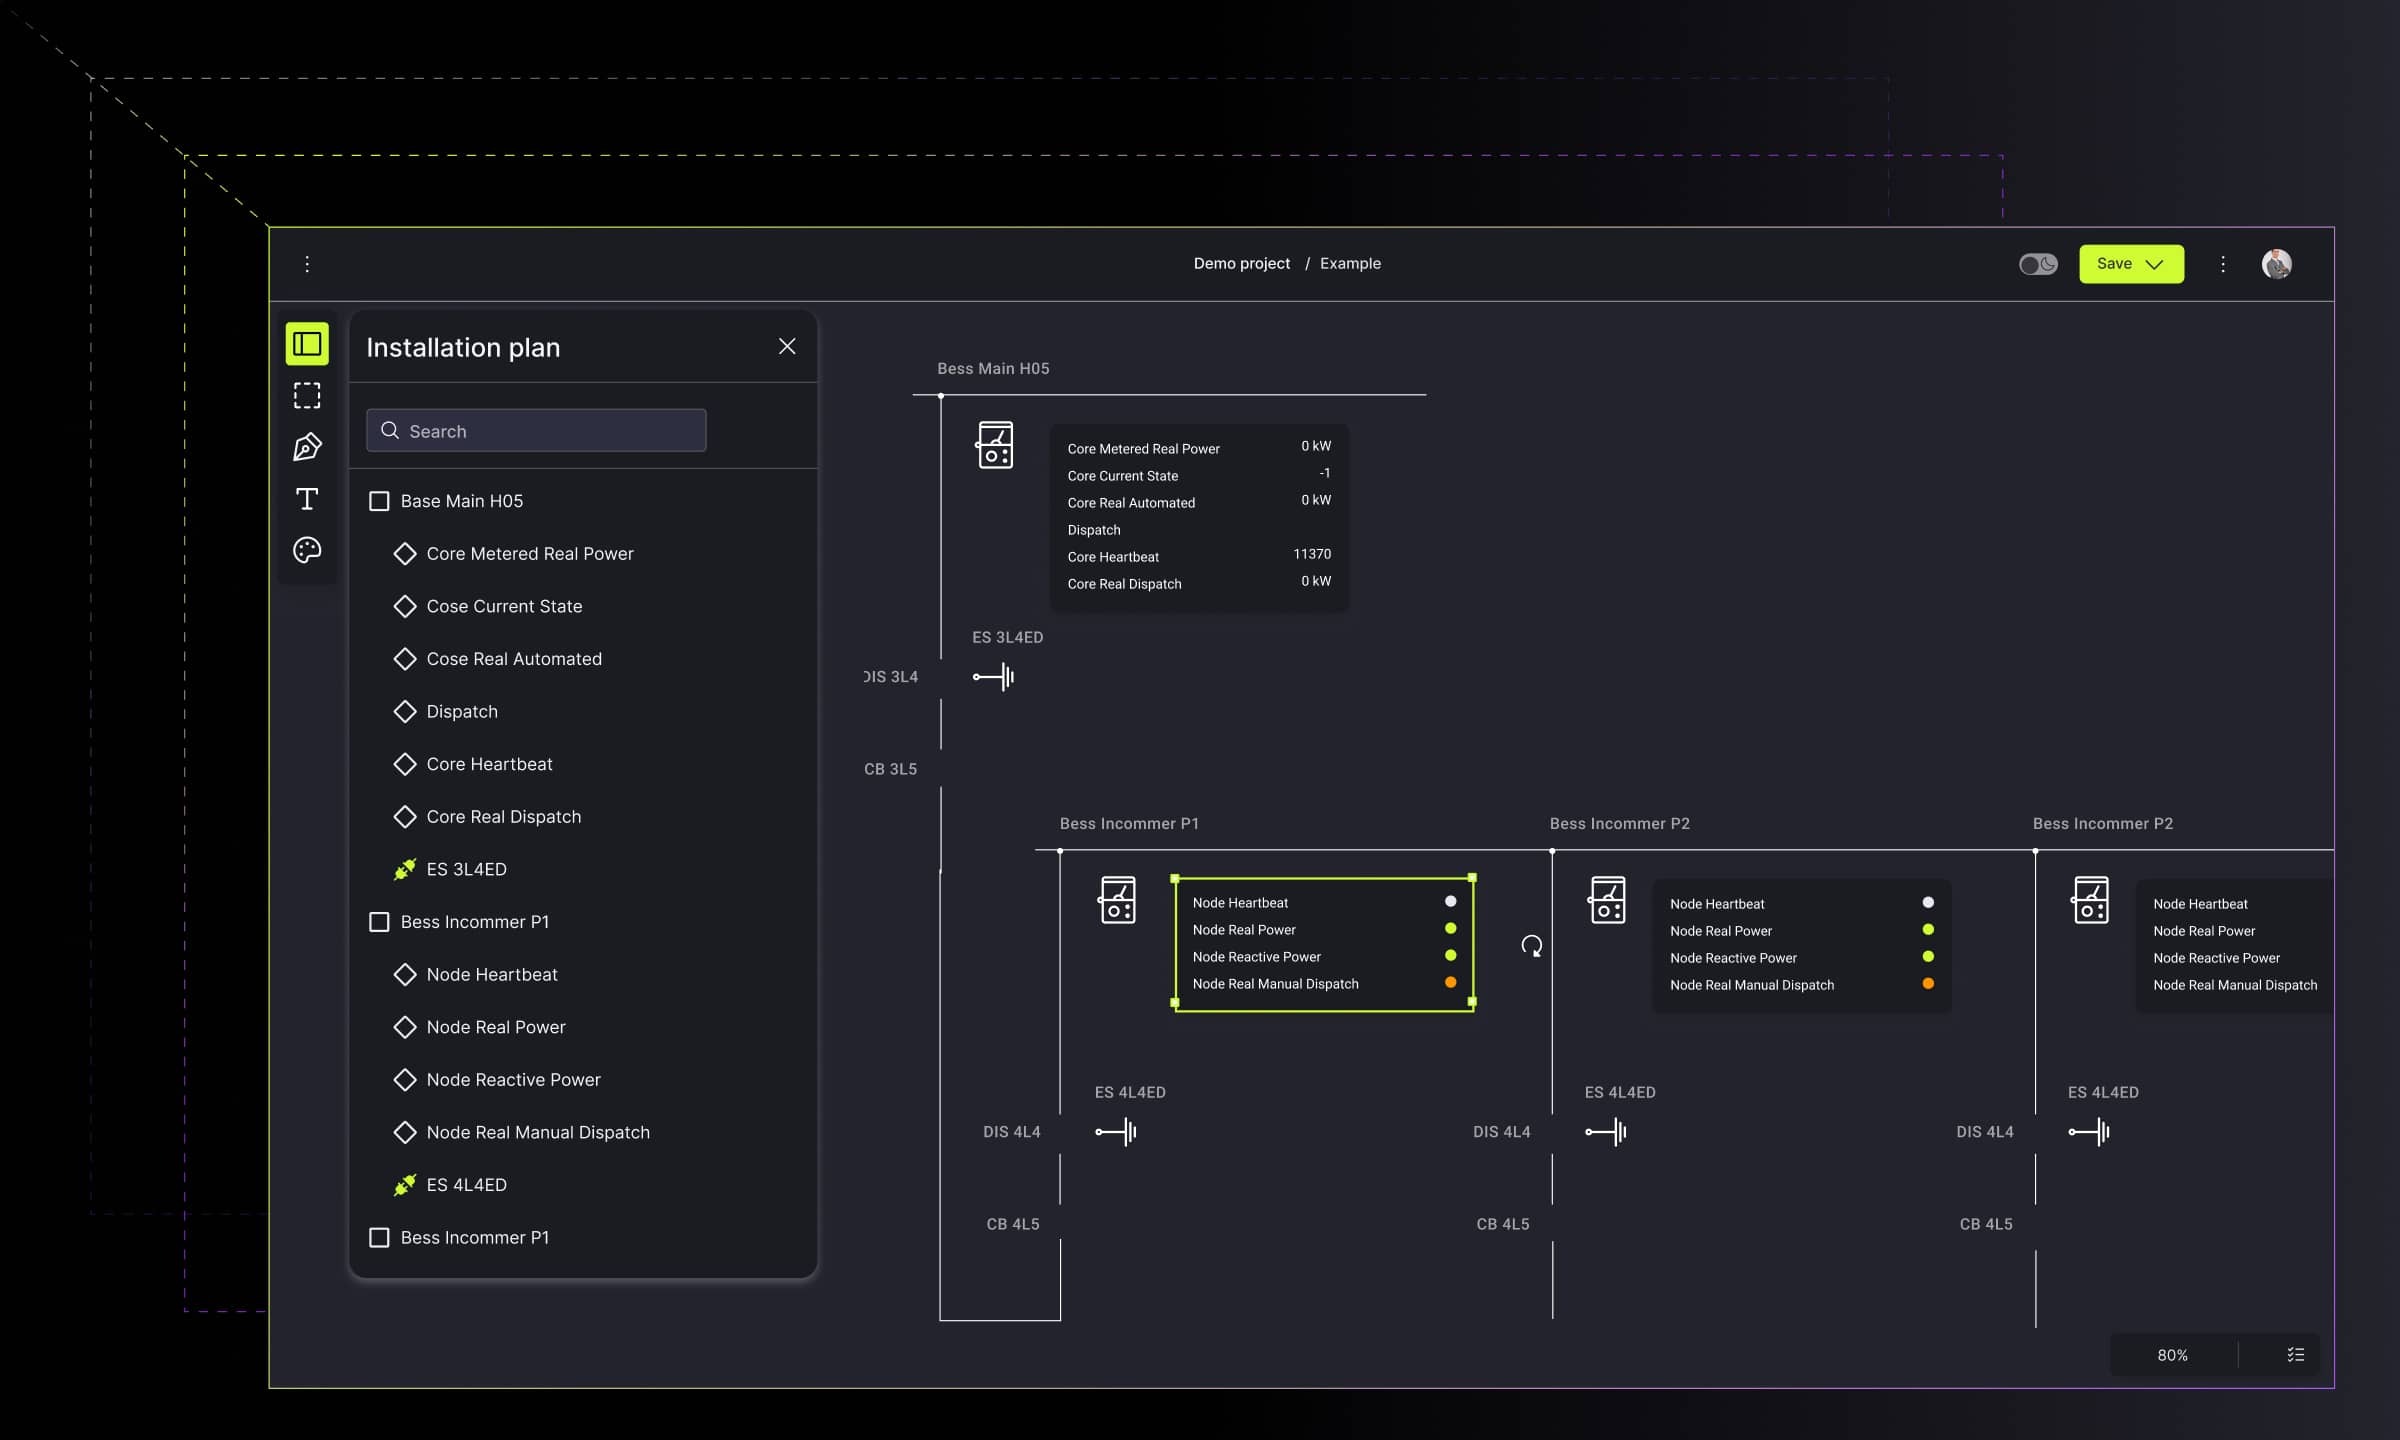
Data visualization, as commonly understood, is used to increase readability through the graphical representation of data. You can achieve it in different ways. One of them is the use of diagrams. When accurately designed (e.g., using the GoJS library), they enable effective communication and process mapping. On the example of our tool for building smart production lines - Smartly - you will find out 4 functionalities that support working with real-time data in diagrams.
If you're dealing with diagrams or just looking for solutions that are right for your organization, know that this type of data representation can affect your work with data. The added real-time performance points to even more benefits. These are among others:
- Collecting all data from available databases, hardware, or already existing software
- Reporting events through immediate data import to the report module
- Ad-hoc response to sudden alerts
- Using data in real-time, and thus processing and modifying it
Diagram as an interface
To understand the specifics of data uploaded from different sources (e.g., IoT hardware, existing software, or databases), you can use diagrams that process data in real-time.
When building a diagram to collect data in real-time, use clear dashboards that will support you in gathering information on mission-critical production data. Receiving immediate notification of errors or alerts will allow for a quick and effective response. What's more, the diagram acting as an interface also allows you to configure appropriate notifications that result from the connection of sensors. In this way, you can obtain and manage data from many sources, and your work is error-free.

Diagram as a reporting tool
When managing an externally driven project, reporting is a necessary step in determining what's happening with that data.
The thing you can do is import the data to the report module immediately. The use of real-time operations allows for a detailed view of collected data. While gathering information from sensors by a diagramming application, you get a real-time view of the status of our project. We can modify the data on an ongoing basis, extract or group it. Having a fully interactive and intuitive panel with appropriate dashboards, reading and selecting data is done with just a few clicks.

Diagram as a quick response tool
With that in mind, you already know that quick responses to unexpected events can be crucial in the decision-making process. The sooner you know about data changes, the better you manage them.
If you use tools supported by real-time technologies, such as WEbsocket, GraphQL, or REST. With Websocket and GraphQL you can count on an almost immediate flow of all data. They cause the alerts to appear ad-hoc in your diagram app. Importantly, having a fully custom solution at hand, you can modify any notifications to suit your project and forward them to other project team members.

Diagram as a tool for modifying and processing data
When working with applications that support real-time data, bear in mind the dynamic change within the provided data. Therefore, as a user of a diagram application that aims to facilitate your work with data, you can effectively use it as a tool for modifying and processing data.
Of course, this is done with carefully crafted custom real-time graphs with report modules implemented, which suggest what is currently happening with your data. Also, you can choose to share the project with other people. They can add or change data as the project develops. By checking the data flow in real-time, you know where you are in the project and how this data can influence your decisions.

Summary
Processing data in real-time in diagrams influences an effective decision-making process supports the fixing or catching errors, and at the same time promotes the necessary corrections to the project. With a tool supported by real-time technologies, your diagram can become a powerful app in your daily work. Not only yours but also for the whole team.
Find how we can help you enhance your software and win more deals
Contact us to discuss your project. After you submit the form, we’ll get in touch with you within 48 hours to arrange a call.


