What is a planogram, and how to leverage it in visual merchandising

Planograms boost retail sales by optimizing product display placement. They streamline operations, reduce waste, and enhance CX with data-driven insights.

Implementing planograms helps you use store space more effectively, guide shoppers’ attention, and improves store performance. By turning product data into clear floor plans and shelf layouts, you control product placement, shorten decision time and boost sales. A well-designed planogram becomes a practical tool that supports daily retail operations and long-term merchandising strategies.
The success of a product depends on a complex set of factors, starting from design and production technology, through choosing suitable suppliers and logistics partners, to effective sales and marketing strategy. One crucial part of the strategy that can get overlooked in e-commerce is how the products get presented on the shelves in a retail store. It is where planograms come into play.
This guide is for retail managers, merchandisers, and store owners looking to optimize their product display strategies. It covers planogram basics, how to create them, and how software can be used.
What is a planogram?
A planogram is a schematic drawing for detailed planning of how and where products should be displayed in brick-and-mortar stores for best sales results. When used skillfully for visual merchandising and space planning, they maximize sales and minimize waste for store owners and product manufacturers.
Planograms help retailers use store space more efficiently, which increases customer satisfaction and boosts revenue. They also support creating clear, attractive displays that tap into shopper psychology and drive more buys, including impulse purchases. This article will discuss how to get started and design effective planograms for the best business benefits for both manufacturers and retail sellers.
Now that we've covered the basics of what a planogram is, let's look at some common types used in retail settings.
Planogram examples
Planograms can be divided into two basic types: floor plans and shelf space plans. They could also be described as retail space plans and visual merchandising plans. They are used together for planning inventory and product display on a macro and micro level.
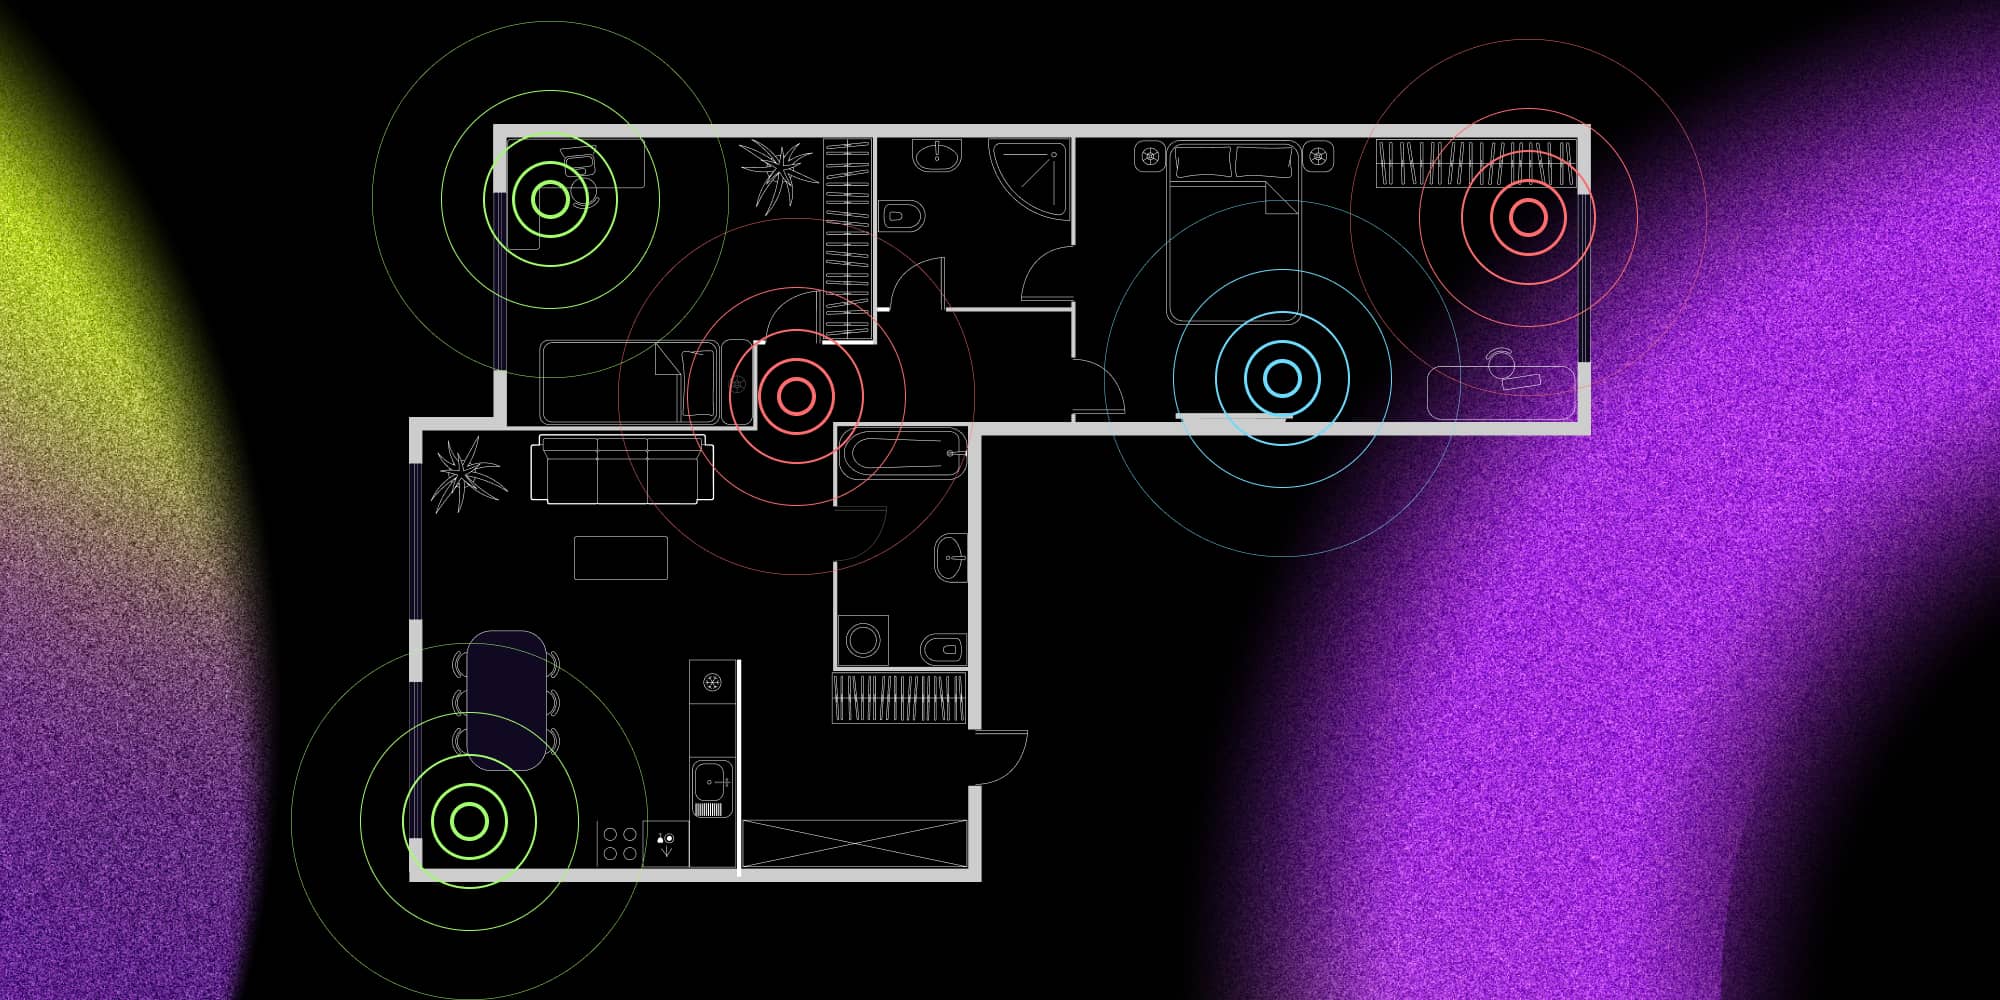
Retail planogram for space planning
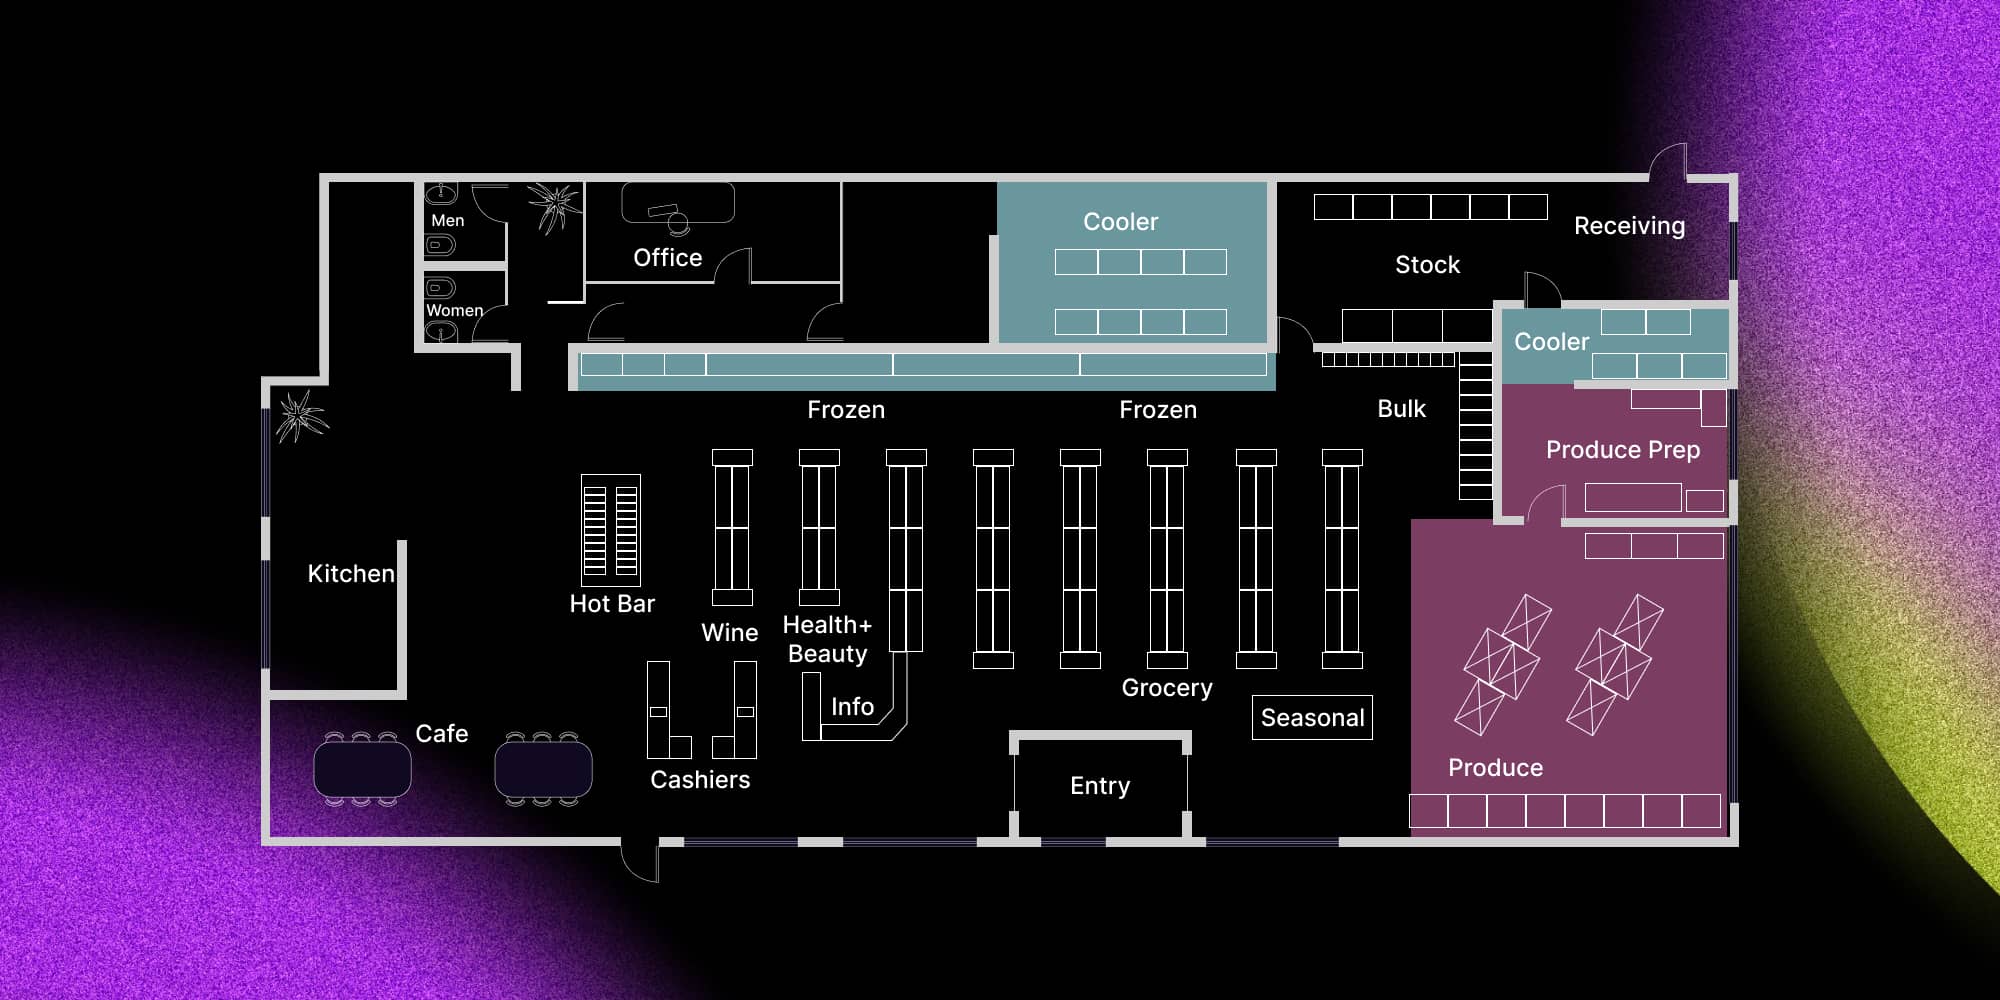
Floor plans are visual diagrams representing a bird-eye view of the retail space. These planograms are best used to map out the path a customer should take through the aisles and specific areas of the store to make their shopping experience engaging and maximizing their purchase value. Designers experienced in retail space planning will ensure that customers find the highest value offers in strategic spots (preferably at eye level). They will also plan product placement so that customers spend longer exploring the displays and special offers without making it frustrating to find what they came in to buy.
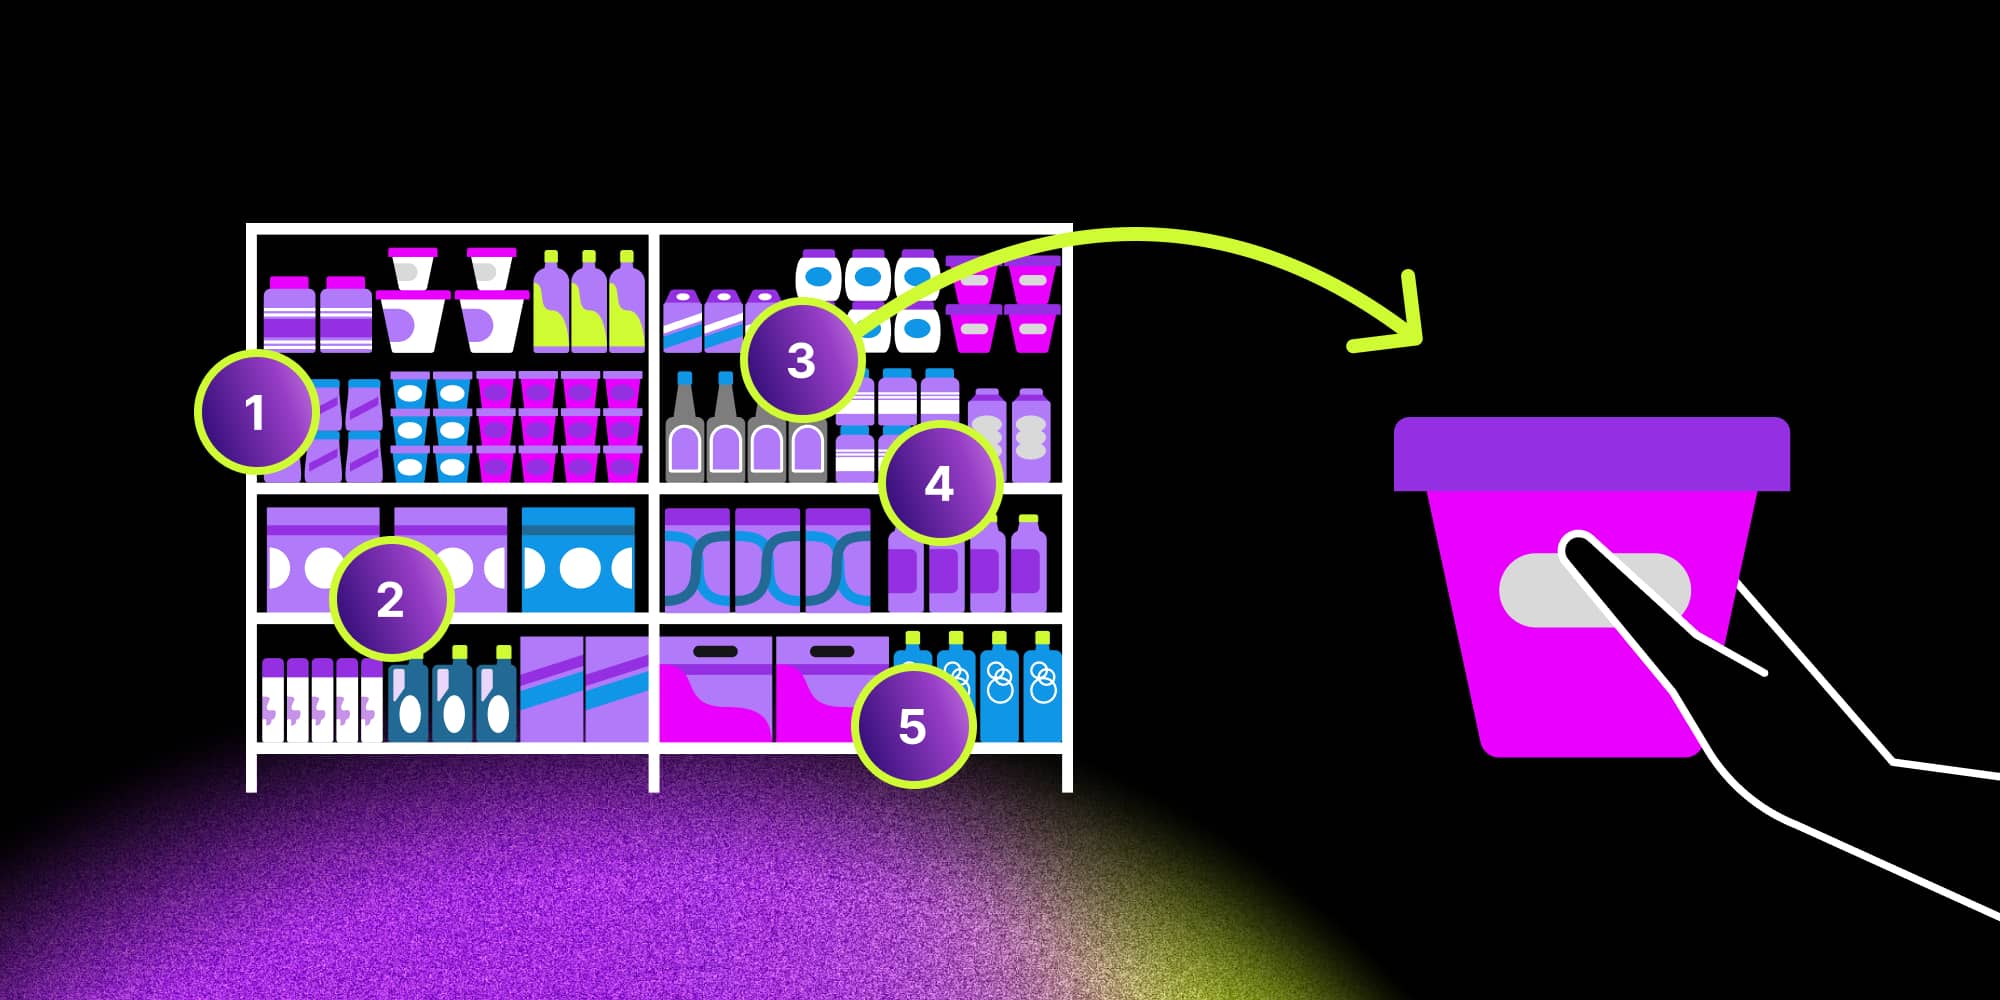
Planograms for shelving design and product display
This type of planogram is used to design how products are displayed on shelves, platforms, racks, mannequins, baskets, and other retail fixtures.
Store managers and retail store chain directors rely on shelving design planograms to optimize shelf space usage and maximize sales of high-value products. Those planograms increase sales by placing high-margin products in prominent positions, such as at eye level and near checkout counters. On the other hand, product manufacturers often prepare their planograms to demonstrate the ideal display of their offer. The role of sales and store managers is to find a balance between the retail company's merchandising needs and those of different suppliers.
While retail chains may strive to unify their product display guidelines to minimize the need for management and maximize the use of successful planograms, each store location has slightly different customer profiles and physical space, so merchandise layout and shelving usually vary depending on location.
Now that you've seen common examples of planograms, let's move on to how you can create one.
How to create a planogram
Planograms can be created with various tools – from a piece of paper and a pen to dedicated planogram design software. There are professional planogram specialists, visual merchandisers, and retail space designers specializing in different areas of designing a compelling retail experience.
But most small and medium retail businesses, and even retail chain companies, can make a well-designed planogram by following good practices and using the right software. The process of creating planograms includes the following basic steps:
Develop the concept of the store
The general layout and the trade equipment choice for a clear and appealing display of products.
Develop sales strategy, and analyze turnover rate, foot traffic, and product categories
Products of the same category should be grouped but consider featuring those from different categories likely to be bought together, such as beer and salty snacks or bread and jam.
Create a retail space planogram to depict the general store layout
Include aisle positioning and categories, specify seasonal displays, sitting areas, entrance and exit, and cash registers – display functional points, such as restrooms, kitchens, warehouse, and backroom. Don't forget to include windows and consider including information on the lighting design.
Create the display design planogram to illustrate the exact placement of each item on retail display fixtures
Incorporate visual merchandising good practices and retail analytics insight collected by observing foot traffic, turnover rates, and customer behavior.
Approval, implementation, and review
The store planograms should be approved by the store manager, regional manager, or higher, depending on the company structure. Some suppliers may also demand specific shelving displays of their products and thus need to be involved in the approval process.
After that, the implementation of a fresh planogram should be followed by regular reviews and updates. As stock levels and product catalogs change, product displays should adjust to what's available and how local customers behave in the store's space.
Choosing planogram software
Planograms can range from simple visual diagrams to detailed 3D renderings of the retail store space.
Planogram software for universal product placement
As visual merchandising is an established retail practice these days, there are many planogram software solutions to choose from. A few dedicated planogram platforms or universal drawing software: Smart Draw, Shelf Logic, or One Door's Merchandising Cloud.
Planogram tools for more data driven decisions
Since data analytics is almost universally an integral part of any retail business process, planogram solutions are often integrated with robust ERP or retail management platforms. It allows visual merchandisers and retail space designers to apply and enrich insight collected across the sales funnel, different organization departments, and the whole value chain. Some popular software platforms that meet these needs are Quant and Leafio.
Custom product positioning with GoJS and React planogram
A different way to achieve full integration into the IT ecosystem and management platforms already used by the company is to develop a custom planogram solution from scratch. GoJS provides the software libraries and graphic interfaces to do just that, with drag-and-drop capabilities, customizable product libraries, database integration, and other powerful features. This page shows a simulation of a fundamental planogram diagram tool.
GoJS integrates smoothly with React, which makes it a strong base for creating a React planogram application. In this setup, React provides the user interface for e.g. browsing products or shelf layouts, while GoJS handles the visual logic. React's component-based architecture allows developers to break the UI into small, independent, and reusable components for planogram interfaces.
What to look for in good planogram software
It might be challenging to decide which one to implement among the many software solutions. The correct answer might provide these five benefits:
Intuitive and efficient graphic interface
Although 3D rendering of store displays is an impressive feature in planogram software, it is not strictly necessary. What is reasonably required, though, are functionalities like drag & drop, dynamic display of product properties, and the capability to create planograms in both floor plan view and merchandise display, with real-time suggestions of optimal placement for items.
Product and equipment libraries
An essential feature would be a product library with detailed specifications of each SKU, such as packaging type and dimensions, facings, storage conditions, shelf life, suggested categories, and commodity neighborhood. Well-designed planogram software should also provide a library of display fixtures, customizable for those currently owned by a given retail store.
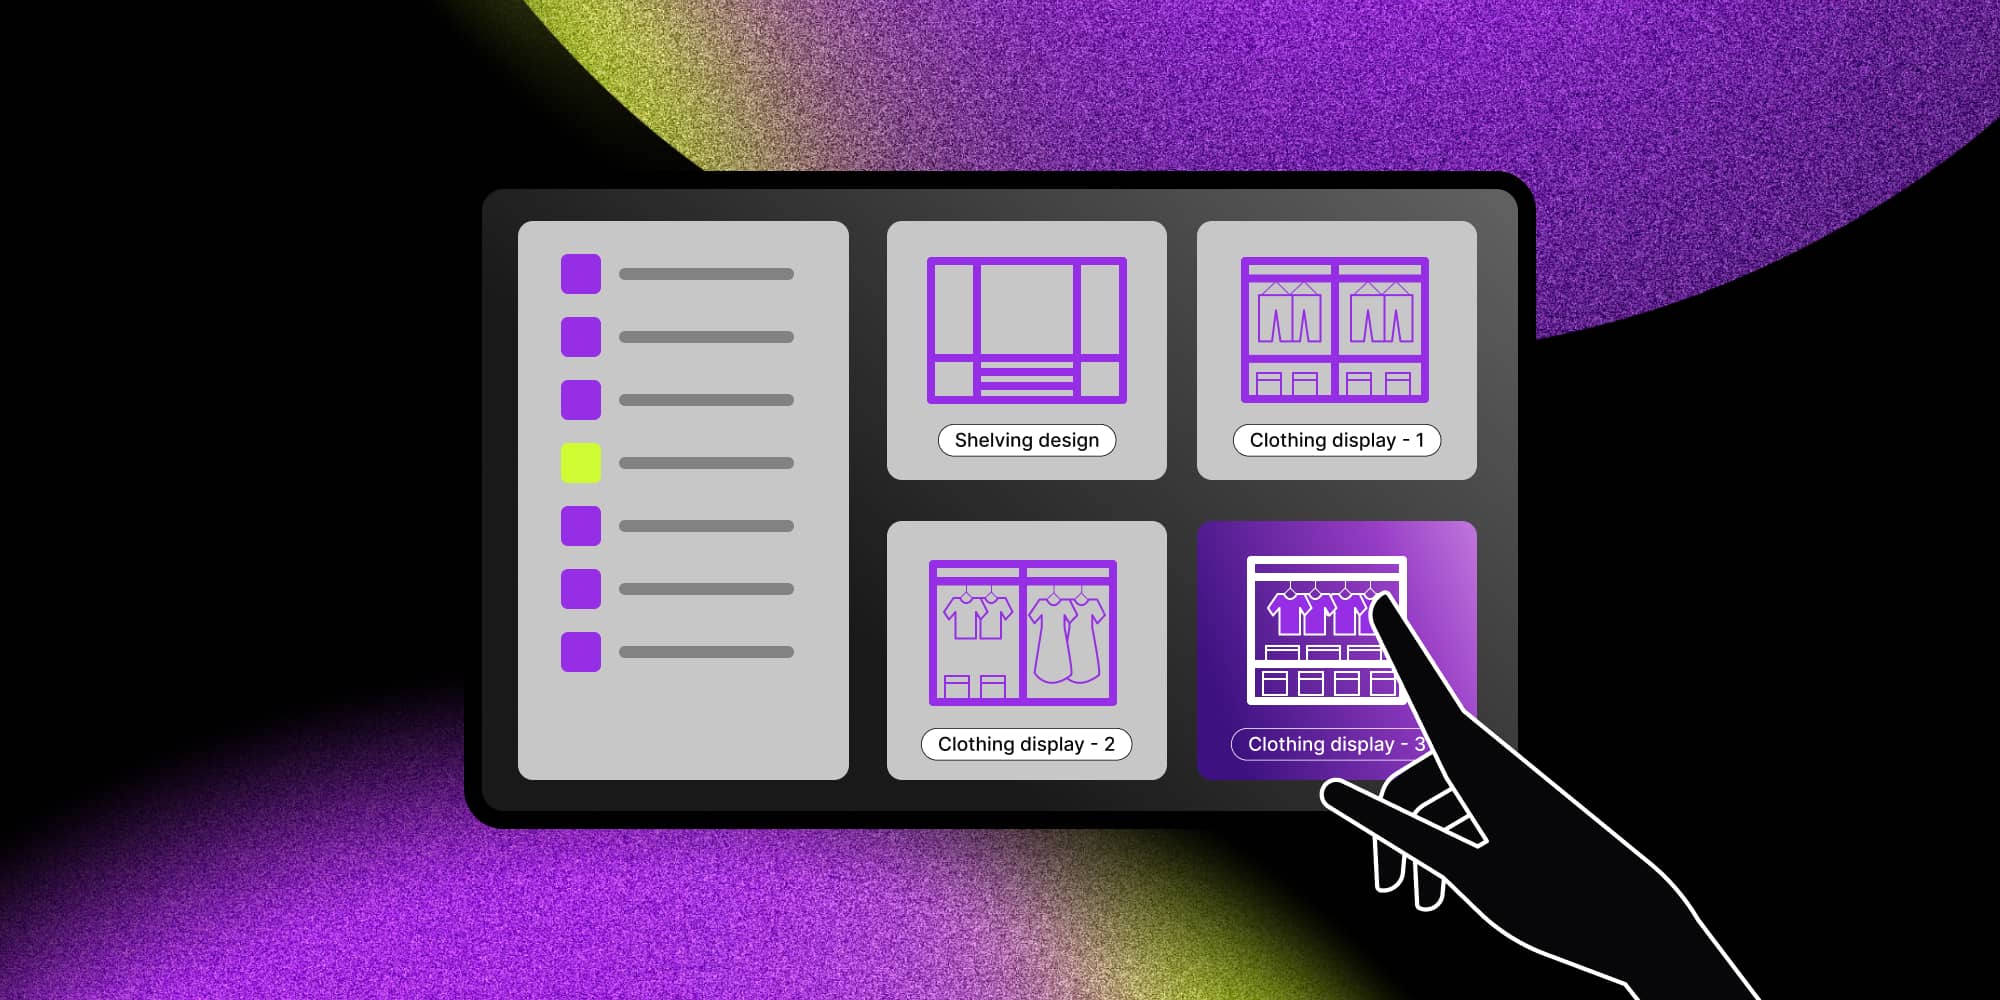
Planogram templates
Having a library of reusable merchandising templates that have been proven successful can mean significant operational cost savings, especially for big box stores that are part of a retail chain. For smaller retailers, having access to ready-to-use effective planogram templates and well-designed planogram examples can also be a simple way to boost sales and improve return on store space investment.
Deep integration into existing corporate systems and processes
This benefit may be hard to achieve in previous generation inventory management or planogram software. It's one of the reasons why big retail companies look for software development partners: the legacy retail management solutions they use don't provide the API functionalities needed to leverage valuable data insights and modern technologies such as RFID or IoT. Well-designed planogram software should offer integration with POS systems for inventory monitoring and insight into product popularity. Advanced planogram systems integrate with other retail data to optimize product placements based on real-time performance metrics.
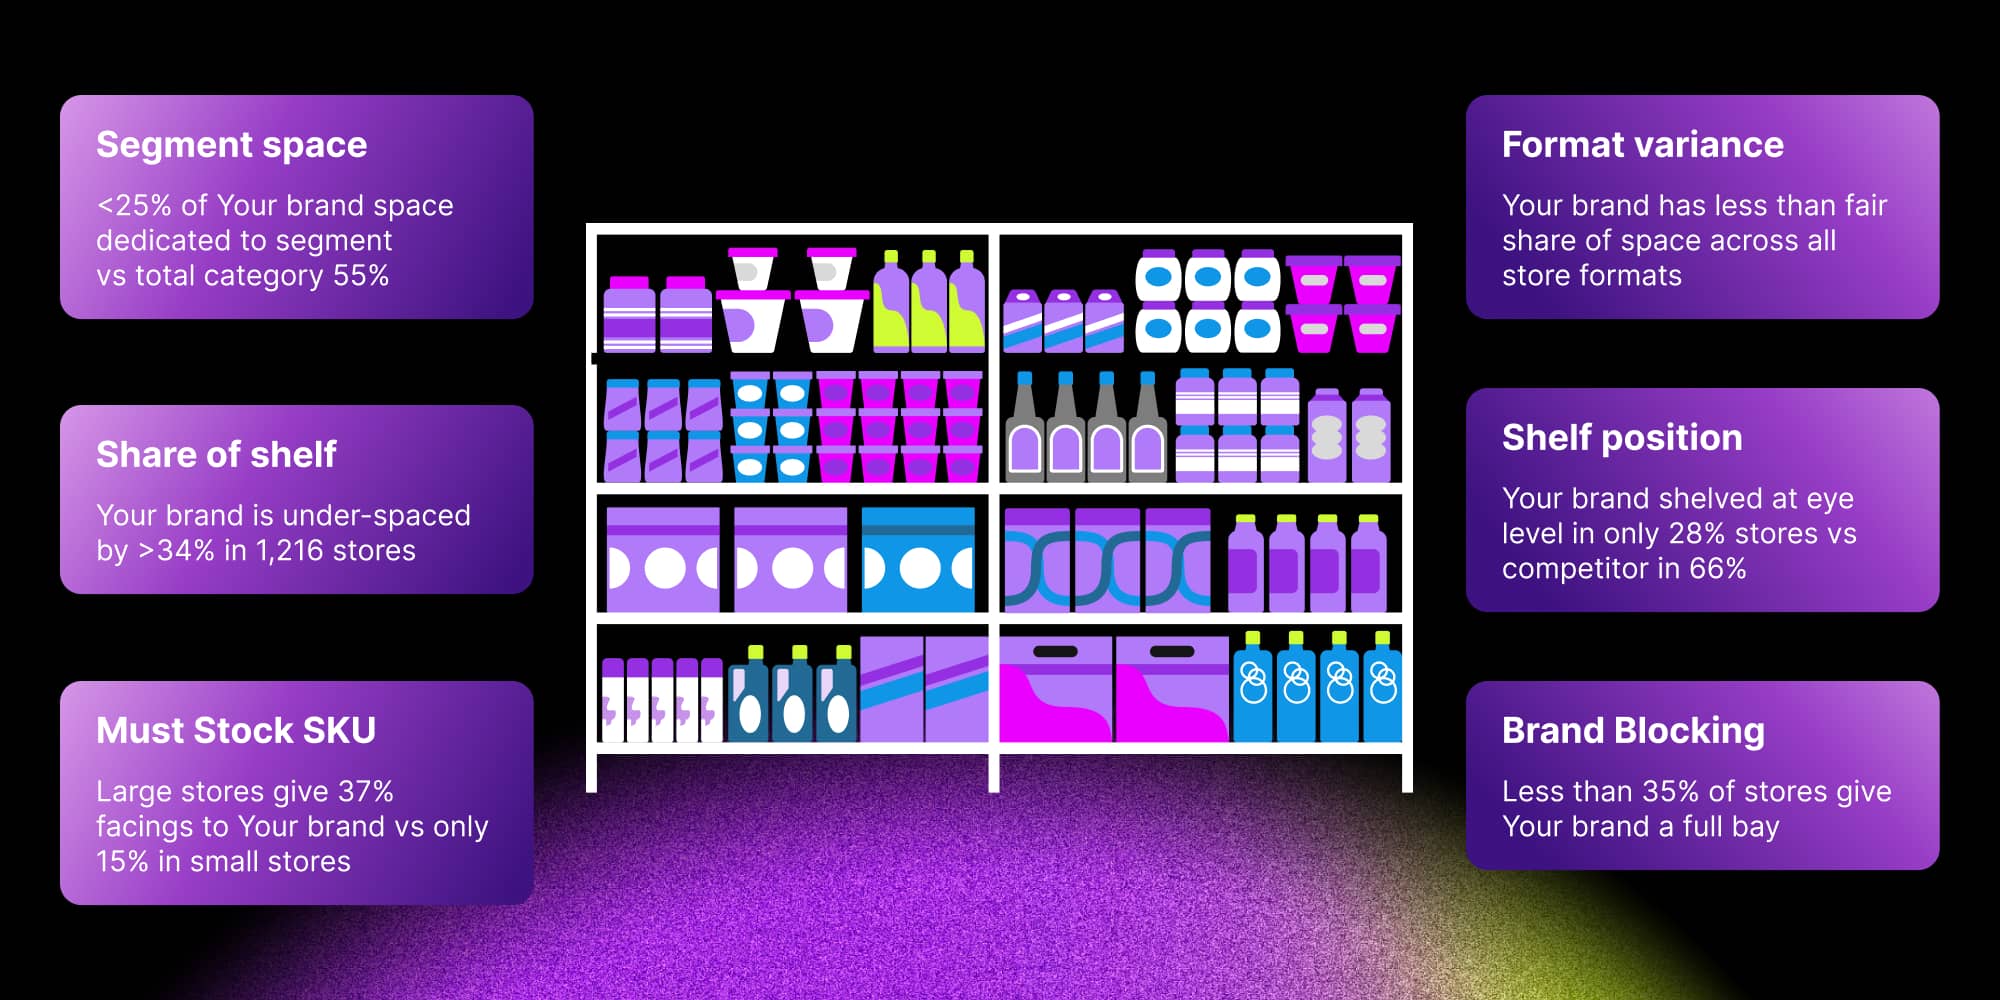
Robust analytics and optimization features
Planogram software should ideally offer real-time monitoring or reporting across different periods to harness the power of valuable data. This reporting should encapsulate data on the given store's inventory and customer behavior, and foot traffic. Analytics of data across different store locations and a heat map would be powerful features for visual merchandising and optimization.
How to increase revenue with a good planogram design?
Intelligent and appealing retail store layout and merchandise placement help you grow your revenue by making customers spend more time at the store. It supports finding a maximum number of the products they may need - even if they hadn't known they needed them when they entered the store. Here are some good practices for creating planograms.
Using retail planograms for shelf space planning and visual merchandising
Planograms are especially useful for retailers or grocers with a wide range of products and categories from multiple vendors. They work best when created by visual merchandising specialists or experienced store managers who understand shopping behavior and know how to increase the average basket size. Some of the good practices to incorporate into effective planograms are:
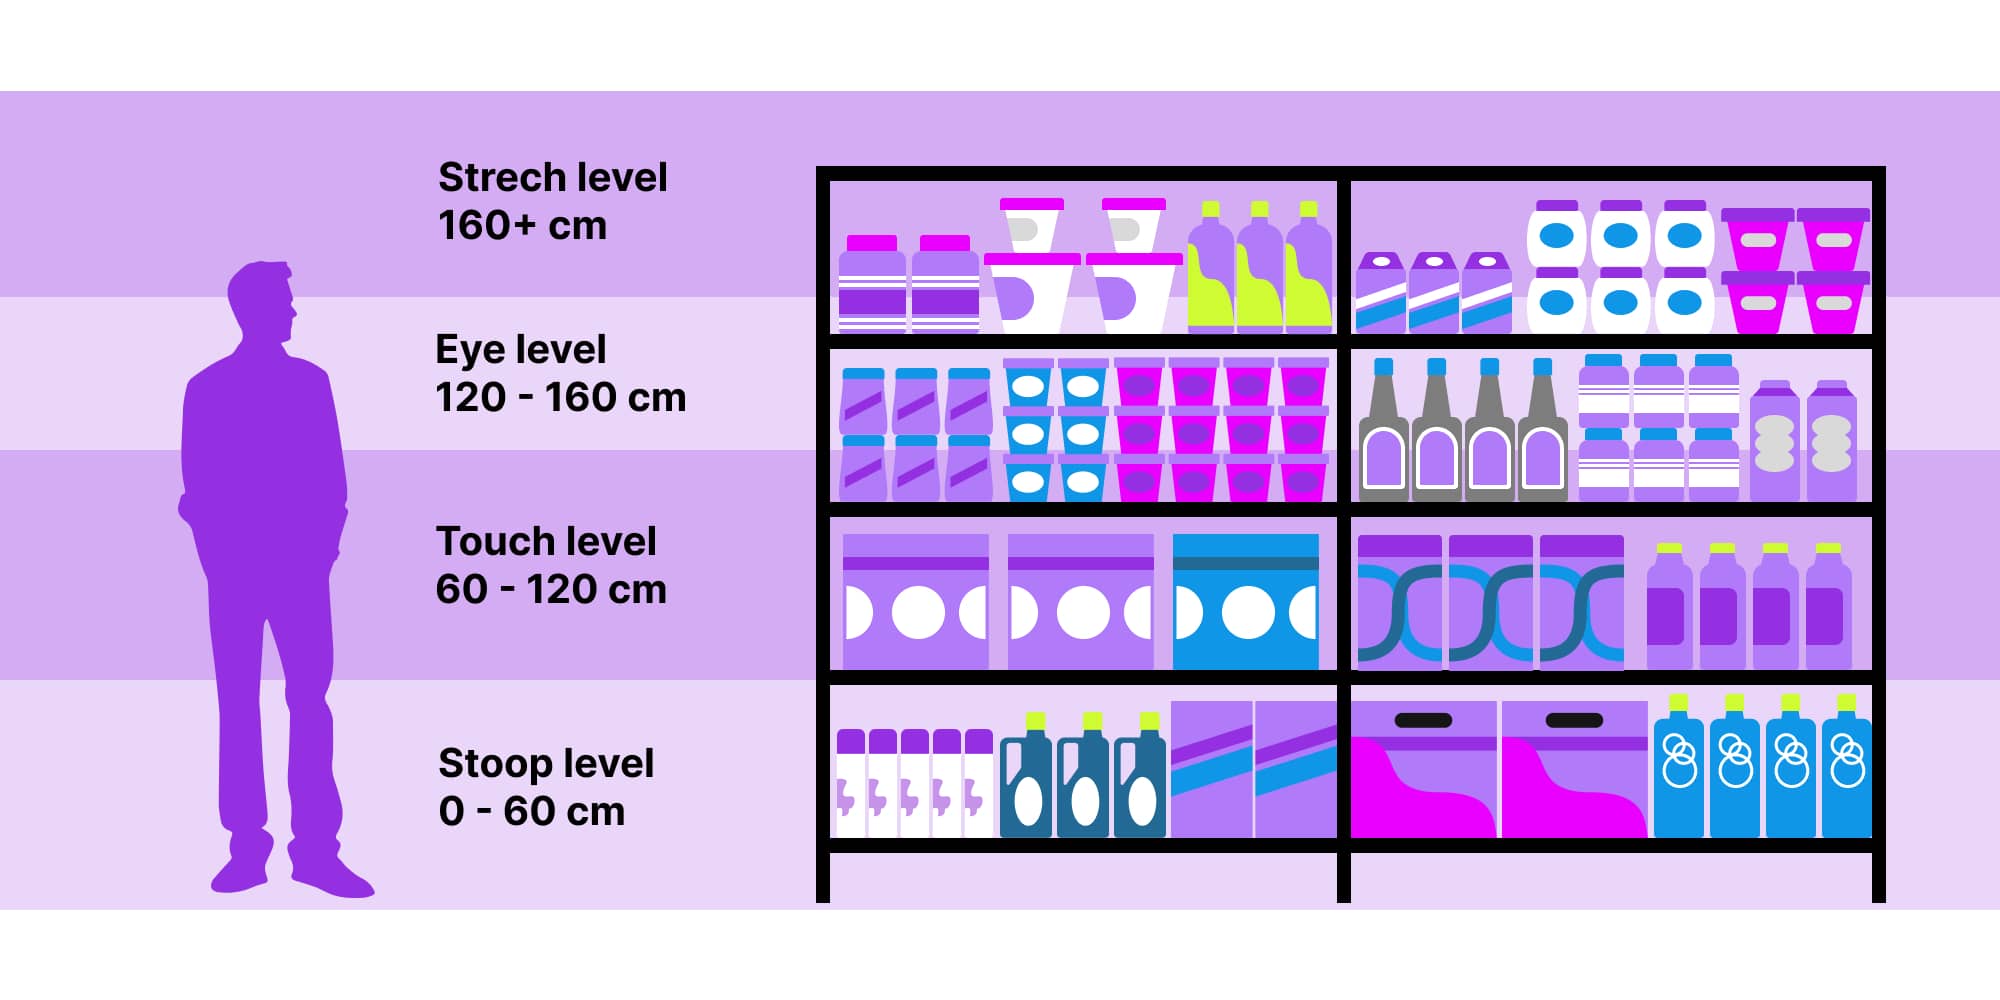
- Put the most valuable merchandise at the eye level of the target customers. Remember that eye-level differs for adults and children. For example: healthy and lifestyle food goes on the shelves at adult eye level, sweets, and toys on the lower store shelves.
- Experiment with the best product coupling to leverage cross-merchandising. Example: place pasta next to pasta sauces and colanders, cereal next to milk, jackets next to scarves, smartphones next to phone cases, and so on.
- Carefully design lighting and pick music and fragrances that the customers encounter on their shopping route. For example, the smells of freshly baked bread or vanilla are known to increase appetite, while the choice of lighting color affects the perception of the freshness of food.
Using planograms for data-driven retail management
Intelligent planogram software and methodology don't just rely on sensory merchandising principles and behavioral psychology. It also incorporates insight from multiple business processes and collects detailed shopping metrics to use them for the continuous improvement of retail store profitability.
Some good practices of data-driven planogram management are:
- Analyze historical sales data combined with experimenting with shelving design. This helps you pinpoint which products are underselling because of their lack of exposure instead of simply not being attractive. If something is in a visual hot spot and still underselling, it should be removed from the offer.
- Combine planograms with IoT monitoring to analyze where customers spend the most time.
- Planograms are usually integrated with inventory management software. They can also be coupled with trackers on items (such as RFID chips) to display in real-time where items need restocking or where they were put away by customers. This is especially useful during seasonal sales, when store traffic is frantic, and popular items are harder to locate in the chaos.
Benefits of planograms – not just visual merchandising
The benefits of effective planograms are pretty clear by now regarding their ability to steer the customers' attention towards more valuable purchases. The benefits go much further than the effort to maximize sales.
- Well-designed planograms reduce the cost of running retail stores by reducing waste (putting products with shorter shelf life in more exposed places).
- Planograms can increase retail profits by avoiding lost sales opportunities due to overstock and stockout situations.
- They also reduce wasted space so that more products can fit on the store shelves.
- Planograms help employees control inventory more closely and replenish products more accurately.
- Planograms can teach retail teams how to arrange products by showing the data behind each layout. That’s why they streamline employee training and make it easier to implement successful merchandising strategies across the entire retail chain.
Create effective planograms to improve customer satisfaction
Planograms are an easy-to-use yet effective way to increase revenue in a retail store by using intelligent space planning and visual merchandising principles. With the right graphic software deeply integrated with the IT ecosystem of a retail business, they can be a powerful way to leverage valuable data in the physical sales process and continuous improvement.
- What are examples of planograms?
Examples of planograms include simple shelf layouts that show where each item should go on retail shelves, as well as more detailed diagrams for shop sections. A classic example is a grocery aisle where vertical product placement displays cereals from top to bottom, while horizontal product placement groups in product categories like granola, oatmeal and porridge at eye level to attract customers and increase sales. There are also full–store planograms that map the layout of the entire store, showing where major categories, aisles, and promotional zones should be placed to guide customers smoothly through the space.
- How do planograms improve customer experience?
Planograms enhance customer satisfaction by helping shoppers find what they need faster. Clear shelf layouts reduce confusion, shorten shopping time, and guide customers toward products that match their needs. They also make shopping easier by placing related product categories next to each other – for example, pasta and sauces in one spot help customers finish their shopping without walking around the entire store.
- What does a planogram specialist do?
A planogram specialist analyzes sales data and customer behavior to understand how products should be arranged on retail shelves or at the grocery store. Their goal is to use strategic product placement to increase sales, improve customer flow, and make the store easier to navigate.
- What information is used during planogram creation?
Retailers combine sales data, product categories, packaging specifications, and store layout constraints to build a layout that fits real shelf space. This approach ensures that arranging merchandise aligns with business goals and reflects how customers move through the store.
- What tools can I use to create a planogram?
You can create planograms with universal drawing tools or dedicated platforms such as SmartDraw, Shelf Logic or One Door’s Merchandising Cloud. For more data-driven needs, retailers use solutions like Quant and Leafio, which connect directly to ERP systems and sales data. However, if your business requires full customization and integration with existing software, a custom planogram built with React Flow, GoJS, or ngDiagram can give you complete control over product placement and store layout.
Content Marketing Specialist who's spent the last decade making tech topics actually readable. With an MA in Brand Communication, Ida has crafted content strategies for several IT companies. Her portfolio spans from Kubernetes tutorials to enterprise software guides, now focusing on data visualization and diagramming solutions.

Find how we can help you enhance your software and win more deals
Contact us to discuss your project. After you submit the form, we’ll get in touch with you within 48 hours to arrange a call.


