What is multigraph in data structure? Definitions, implementations, and use
.jpg)
Explore multigraphs in data structures, their applications in networks, and popular visualization layouts like force-directed, hierarchical, and circular.
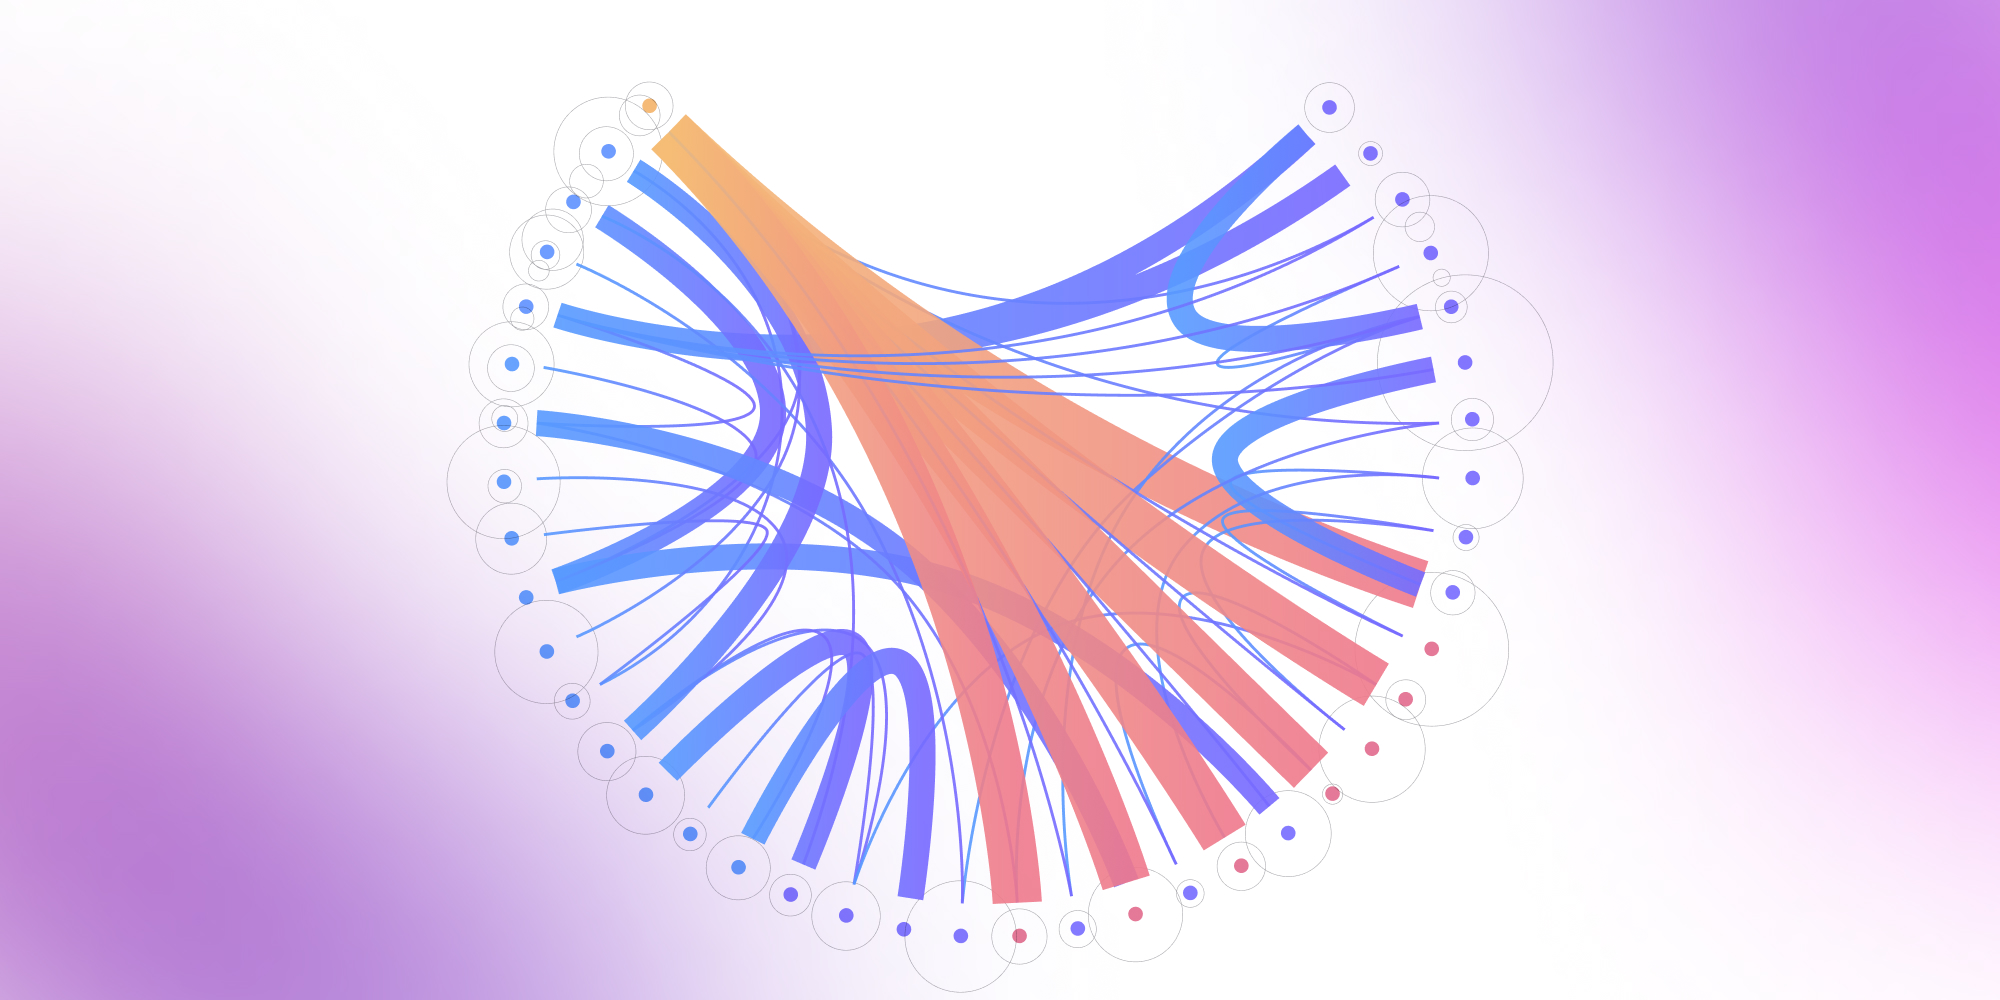
Multigraphs reflect the reality of modern systems where entities connect in many ways – not just once. Multiple edges, weighted links, and nested structures let teams capture transportation paths, social interactions, or system dependencies with precision. Combined with layouts like force-directed and hierarchical, they reveal patterns inside even the most layered network.
The more data-driven companies become, the need for quality data visualization grows, but the challenges of choosing the proper layout for complex data structures follow right behind. A multigraph is formally defined as a graph in which more than one edge can exist between the same pair of vertices, allowing for multiple relationships or connections between the same objects.This blog post will discuss the ones connected to selecting the layout for multi-level graph visualization.
What is multigraph in data structure?
Definition and core concepts
While a simple graph allows at most one edge between any two vertices, a multigraph can have multiple edges connecting the same pair of vertices. Each edge can be defined by attributes or weights, providing additional information about the relationship between connected vertices.
For example, in transportation networks, a multigraph models multiple routes between locations with different attributes like travel time or transportation mode. In social networks, different edges describe various relationship types between individuals.
Note: Some researchers reserve "multigraph" for graphs with only multiple edges, while others include self-loops (edges connecting a vertex to itself).

Picture: grey: nodes, blue: loops, red: edges
(source: Wikipedia)
Technical representation
In technical terms, nodes and vertices in a multigraph are considered objects, which can be of any hashable type in data structures. The structure of a multigraph can be represented using adjacency lists or an adjacency matrix, where the matrix encodes the number of edges between each pair of vertices.
For example, an adjacency matrix for a multigraph will have entries greater than one if there are multiple edges between two nodes. These representations help model complex relationships, and the details and attributes of nodes and edges are stored in dictionaries or similar structures, allowing users to access and modify them efficiently. Edge data can be provided as lines in a file or code, making it easier to initialize or update the graph.
Multi-level graphs and visualization challenges
Beyond the challenge of multiple edges, multigraphs often exist within larger hierarchical structures. A multi-level graph contains nested structures, for example, groups containing children or other groups, relations between children in one group, children from different groups, children and groups, and/or between entire groups.
This is the most challenging type of graph because it can be approached in two ways:
1. By showcasing the content of each group with one layout and then covering the groups with a different layout
2. By using an advanced layout that can account for the whole nested structure and position all nestings simultaneously as one graph
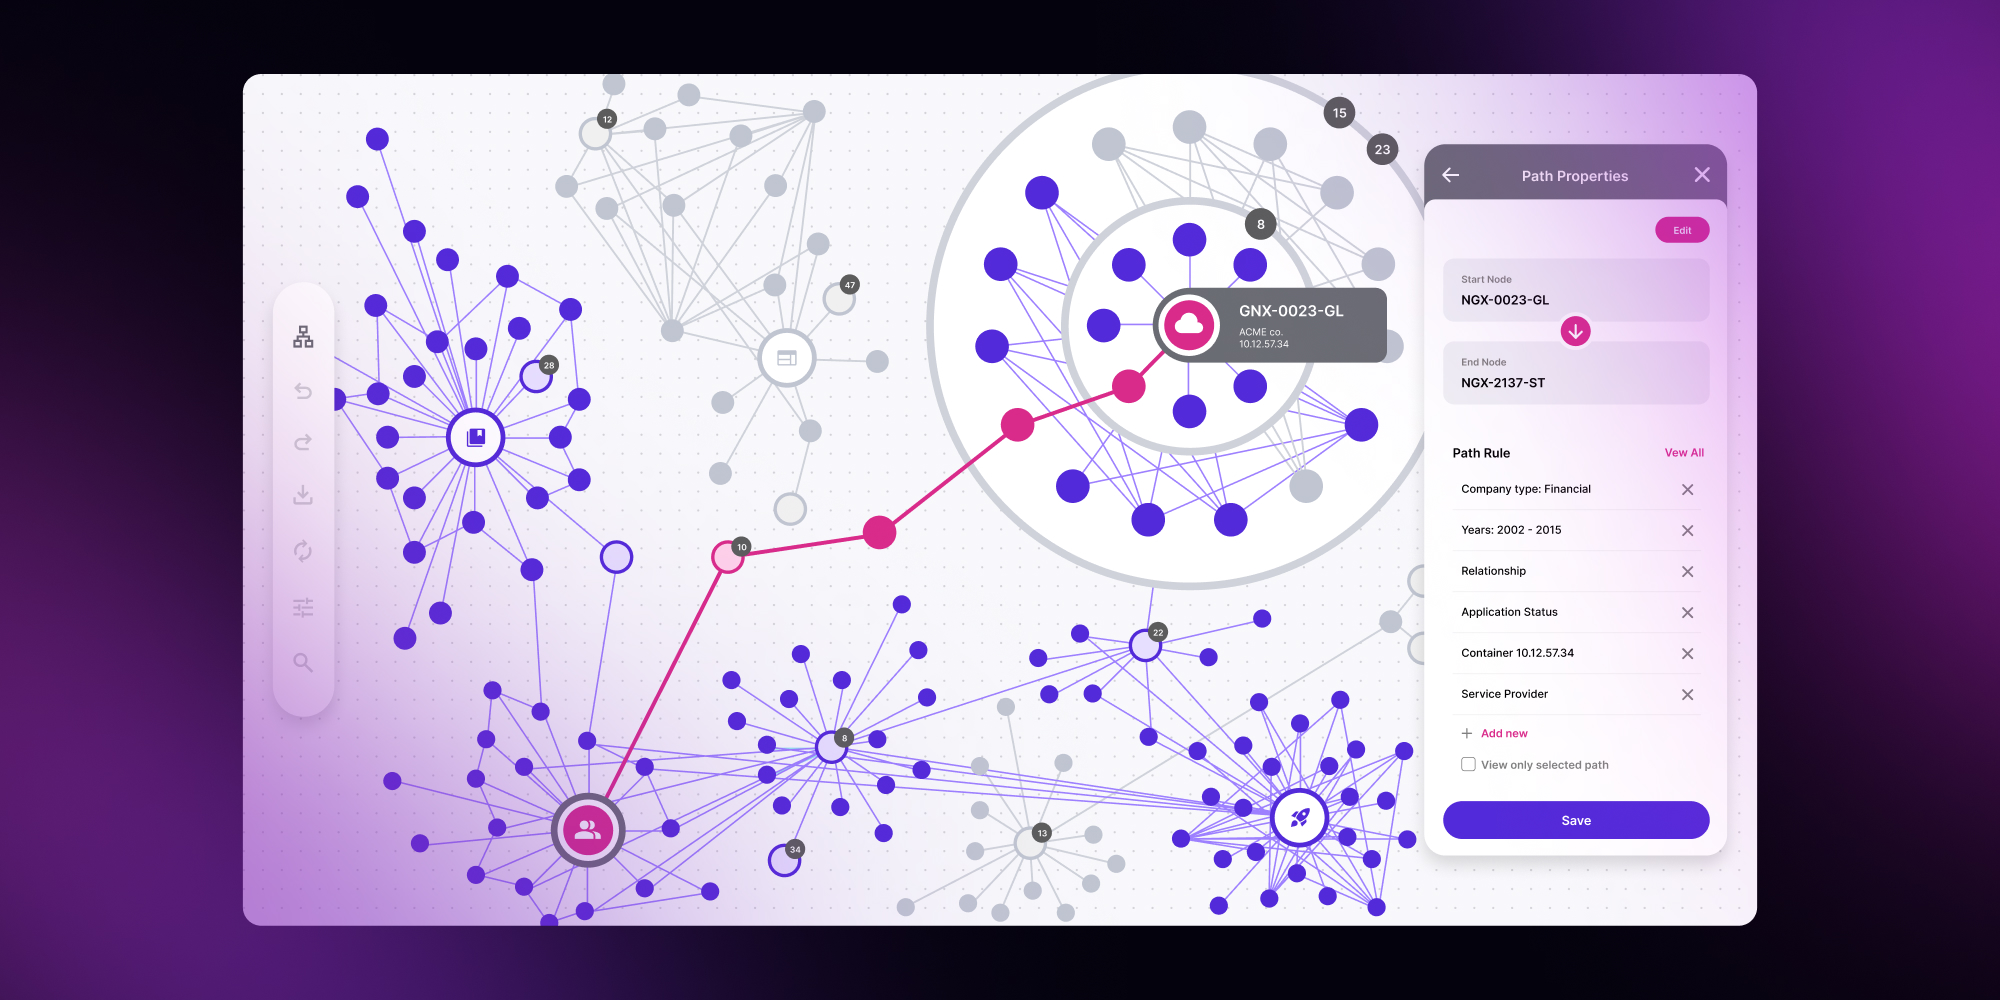
Visualizing multigraphs can be challenging due to the presence of more than one edge between nodes, especially in interactive diagrams. In graph diagrams, color is often used to distinguish elements; for instance, blue loops or blue nodes can highlight specific attributes or relationships within the visualization. Because of multiple edges (in the case of multigraphs) and multiple layers (in the case of multi-level graphs), both types of graphs are considered the more challenging to visualize.
Build better graph visualizations easily
Learn more.png)
Real-world applications
When analyzing a multigraph, both vertices and edges can be counted to better understand its structure and complexity. Multigraphs are often used to model real-world networks such as transportation systems or social networks. Examples of different types of graphs include undirected graphs, where edges allow bidirectional travel, such as in social media friendships or two-way roads.
The hierarchical representation allows for easier understanding and analysis of relationships and dependencies between entities, for example, in computer science, data visualization, and systems analysis, network topologies, decision trees, flowcharts, and more. To overcome the challenges, Data Analysts are forced to use specialized layouts and algorithms to represent and display the graph in an understandable way.
Types of multigraphs
In graph theory, multigraphs allow multiple edges between the same vertices. This capability helps you model complex relationships that simple graphs cannot handle. You can choose from several multigraph types based on your specific requirements:
- Undirected multigraphs: These graphs feature bidirectional connections between vertices. You can add multiple edges between the same vertex pairs. Use these when you need to represent mutual relationships like transportation routes or social connections.
- Directed multigraphs (multidigraphs): Here, edges have specific directions from one vertex to another. You can create multiple directed edges between vertices, including both directions. Apply this type when modeling asymmetric relationships like workflows or communication networks.
- Weighted multigraphs: Each edge carries a weight or label representing cost, capacity, or distance, similar to weighted edges used in workflow diagrams. You gain the ability to represent varying connection strengths. Deploy these for network flow analysis or route optimization projects.
- Multigraphs with self-loops: These structures allow edges connecting vertices to themselves. You can model feedback systems or self-referential relationships. Use this approach when entities interact with themselves in your system.
Selecting the right multigraph type helps you represent complex networks effectively. You can build better data structures for computer science applications and data visualization projects.
Key properties of multigraphs
Multigraphs offer unique features that make them powerful for modeling complex relationships. Unlike simple graphs, they allow multiple connections between the same two vertices. Imagine a transportation network where two cities are connected by highway, railway, and airline routes – each represented by a separate edge.
Another distinctive feature is self-loops – edges where a vertex connects to itself. This proves useful for modeling scenarios like a computer process that calls itself or a person's self-referential activities in a social network. Additionally, each edge can carry different weights and attributes such as cost, capacity, time, or relationship type, making multigraphs ideal for real-world scenarios where connections have varying properties.
When analyzing connectivity in multigraphs, the degree counting includes all edges – duplicates and self-loops alike. This comprehensive counting gives a more nuanced view of how "connected" each vertex truly is within the network structure.
Choosing between simple graphs and multigraphs
The choice between graph types depends on what you're trying to model:
Use simple graphs when:
- Each connection is unique (like "is friends with" in social media)
- Relationships are straightforward yes/no questions
- You need simpler, faster algorithms
Use multigraphs when:
- Multiple relationships exist between entities (like different communication channels between people)
- You need to track parallel routes or redundant connections
- Real-world complexity requires it (transportation, telecommunications, financial transactions)
Think of it this way: if you're modeling Facebook friendships, a simple graph works perfectly. But if you're modeling all types of interactions between people (calls, texts, emails, meetings), a multigraph captures the full picture.
Understanding graph connectivity
In multigraphs, connectivity isn't just about whether vertices are connected – it's about how many ways they're connected. This matters for reliability (multiple edges provide backup routes if one fails), capacity (more edges can mean higher total capacity between nodes), and relationship strength (multiple connections might indicate stronger relationships).
Edge count becomes a key metric in multigraph analysis. A multigraph with many edges between certain vertices reveals hotspots of activity or critical connections in your network. This insight helps identify important relationships, potential bottlenecks, or areas needing optimization, making it invaluable for network analysis and system design.
Methods of graph implementation in data structure
Graphs, regardless of whether we are talking about simple graphs, multi-level graphs or multigraph, can vary with such factors:
- Density
Density refers to the ratio of the number of edges to the number of possible edges in the graph.
- Flexibility
Flexibility involves the need for graph modifications and dynamic updates, such as adding or removing edges or vertices.
- Structure
There is a variety of graphs; some of them are undirected, others are directed, and some contain cyclic structures or tree structures, etc. Every one of them requires a different approach to visualization and using different algorithms.
Edges in data structure
Edges define relationships between nodes and are the most fundamental part of a graph. Without them, a graph would be just a set of independent data.
Edges can be undirected, directed, or weighted. Each type uniquely defines the graph and is associated with a set of valuable algorithms like graph traversal, finding the shortest paths, identifying connected components, and so on.
What is a graph algorithm?
A graph algorithm is a mathematical process or set of computational instructions designed to solve problems to solve specific issues tailored to work with graphs. They use data structures (defined by the edges and nodes) to find paths or cycles, determine connectivity, calculate distances or costs, identify data clusters, and optimize network flows.
The most common graph algorithms:
- DFS, BFS
- Topological Sort
- Dijkstra's algorithm
- Bellman-Ford algorithm
- Prim's algorithm
Types of graph layout
Graph layout is used in the user interface layer to display graphs in an app in the most user-friendly and readable way. In the case of a graph, determining the proper layout involves setting the nodes' location and the links' path. Sometimes it requires computing the nodes' position, while in other cases, their location is arbitrarily known (for example, based on the geographical places).
The most popular type of graph layouts:
- Force-directed layout
The layout aims to evenly distribute the nodes and minimize edge crossings, resulting in a visually balanced representation. It simulates physical forces such as gravity, electrostatics, and spring forces does not impose large requirements on the graph structure (i.e., it requires no cycles), and is often used to represent knowledge graphs. For multigraphs, this layout can separate multiple edges into curved paths to improve readability.
- Circular layout
The nodes in a circular layout are positioned along a circle, with edges connecting them accordingly.
- Hierarchical layout
This layout arranges nodes in a hierarchical structure, where nodes are organized into layers. Multiple edges in hierarchical multigraphs can be displayed as parallel lines or bundled connections between levels. This type of layout often presents a one-way data flow through the graph, and it is used e.g. for data lineage.
- Grid layout
In this layout, nodes are placed on a grid, with edges connecting adjacent nodes.
- Radial layout
Nodes are positioned along circles or arcs in this layout, with edges radiating from a central point.
What should be considered when choosing the best type of graph to display data?
Graph, as every data structure, requires a proper datasets visualization, but defining what the "proper" mean can be challenging and need several factors to be taken into account, such as:
- Data size
Large datasets "closed" in certain graph types may become cluttered or difficult to read.
- Relationship and comparison
The crucial factor in choosing the type of graph visualization is defining what kinds of relationships are within the graph (they can be Whether relationships are directed or undirected, a graph can contain cycles or tree structure, every object can be connected to everything else, etc.
- Audience and purpose
Setting the target audience and defining a goal of data visualization is critical to establishing the level of graph complexity and visual layer, choosing proper colors, labels, legends, and other design elements, etc.
Final thoughts on multigraphs in data structure
Multigraphs represent a powerful extension of simple graphs, enabling the modeling of complex, real-world relationships that require multiple connections between entities. From transportation networks with parallel routes to social systems with multifaceted relationships, multigraphs provide the flexibility needed to capture nuanced interactions.
While their visualization presents unique challenges due to edge multiplicity and potential visual clutter, modern graph algorithms and layout techniques – from force-directed to hierarchical approaches – offer effective solutions. Understanding when and how to implement multigraphs becomes increasingly valuable for data scientists, engineers, and analysts.
Whether you're optimizing network flows, analyzing social connections, or modeling system dependencies, multigraphs offer the sophisticated data structure needed to represent and analyze the intricate relationships that define our interconnected world.
- What is the main advantage of using a multigraph?
A multigraph captures multiple relationships between the same vertices, making it suitable for modeling complex, real-world systems such as transportation, communication, or social interactions.
- How do multigraphs differ from simple graphs?
Simple graphs allow only one edge between two vertices, while multigraphs allow many. This enables richer modeling of parallel routes, relationship types, and heterogeneous connections.
- Why are multigraphs harder to visualize?
Multiple edges and nested structures lead to visual clutter. Layout algorithms must account for edge bundling, node separation, and hierarchy to produce readable diagrams.
- Which graph layouts work best for multigraphs?
Force-directed, hierarchical, and circular layouts are common choices. Force-directed layouts separate parallel edges, while hierarchical layouts clarify direction and flow across levels.
- What data structures are used to implement multigraphs?
Common representations include adjacency lists and adjacency matrices. In multigraphs, matrix entries can exceed one to represent multiple edges.
- How can multigraph visualization benefit from Synergy Codes tools?
Tools like ngDiagram provide advanced layout algorithms, interaction handling, and performance optimizations ideal for rendering complex multigraph and multi-level graph structures.
Frontend Developer with over 10 years of experience building web applications, specializing in React, UX, UI, and data visualization. Has worked on diverse projects from e-commerce to video streaming platforms.

Find how we can help you enhance your software and win more deals
Contact us to discuss your project. After you submit the form, we’ll get in touch with you within 48 hours to arrange a call.


