
Real-time diagram editor for BESS plant operations
Fluence, a global leader in energy storage and grid optimization, needed a way for battery energy storage (BESS) domain experts – not developers – to create and customize the visualizations they use every day to commission, monitor, and operate plants.
The diagram editor was first applied to the plant's primary electrical diagrams – manual, slow to update, and dependent on developers for every change. The same need extended to alarm pages, plant-wide dashboards, and other operator-built views – all of which previously required code changes to the product.
Fluence Energy, Inc. is a leading provider of battery energy storage products, services, and optimization software across 47 markets. It empowers utilities and energy providers to scale renewable energy assets for a resilient, sustainable grid.
A digital solution that would allow operators and engineers to independently create, edit, and visualize single line diagrams and control logic in real time – without relying on custom development for every change.
Design and implementation of a web-based, real-time diagram editor and control logic visualization, integrated with Fluence’s backend, supporting hundreds of elements and custom workflows.
BESS plant diagramming challenges solved with custom diagram editor
Every BESS plant has its own unique electrical configuration – and its own set of diagrams. Static, manually maintained files couldn’t keep up with that variety, and every new plant turned into a new development project.

Static, manually updated diagrams
The plants kept changing. Their diagrams stayed static.
• manually created and exported as static files
• disconnected from real-time voltage, SoC, and frequency data
• couldn't reflect changing configurations or site-specific setups across markets
Diagrams described the system – but didn’t reflect its current state.
Needed real-time, interactive diagrams connected to live system data.
Every change required developer involvement
Even the simplest updates:
• required developer involvement,
• triggered full development and release cycles,
• introduced delays in commissioning and operations.
What should have taken minutes took days or weeks – and every new plant meant another round of code changes to the product itself.
Needed operator-driven editing and instant updates – without IT bottleneks
Operators lacked control over their own tools
The people closest to the system couldn't modify it. Instead, they had to:
• report changes,
• wait for implementation,
• work with outdated or imperfect representations.
Operators knew what needed to change – but had no way to make it happen.
Needed an intuitive interface for non-technical users, with clear feedback and minimal learning curve.
Building an interactive diagram editor layer for BESS plant operations
At first glance, the problem looked like a need for a diagram editor. In reality, it required redefining what diagrams represent.
Workshops revealed that diagrams were more than visuals – they were tightly linked to system logic, live data, and decision-making. The scope shifted from drawing to building an interactive layer for power plant operations.
With multiple user types, evolving vision, and complex data, the team iterated throughprototypes and validated flows continuously – adapting to new requirements as theyemerged.
The platform had to be intuitive for operators, yet powerful for engineers. This meant
drag-and-drop interactions, clear system states, and a minimal learning curve – without
sacrificing control.
Fluence needed highly customizable diagrams, advanced features (rules, alerts,
custom views), and support for large-scale electrical systems. The challenge: deliver
flexibility without breaking performance or usability.
Intuitive diagram editor for faster, error-free plant operations
Empowering operators with real-time insight and streamlined workflows
Drag-and-drop diagram editor
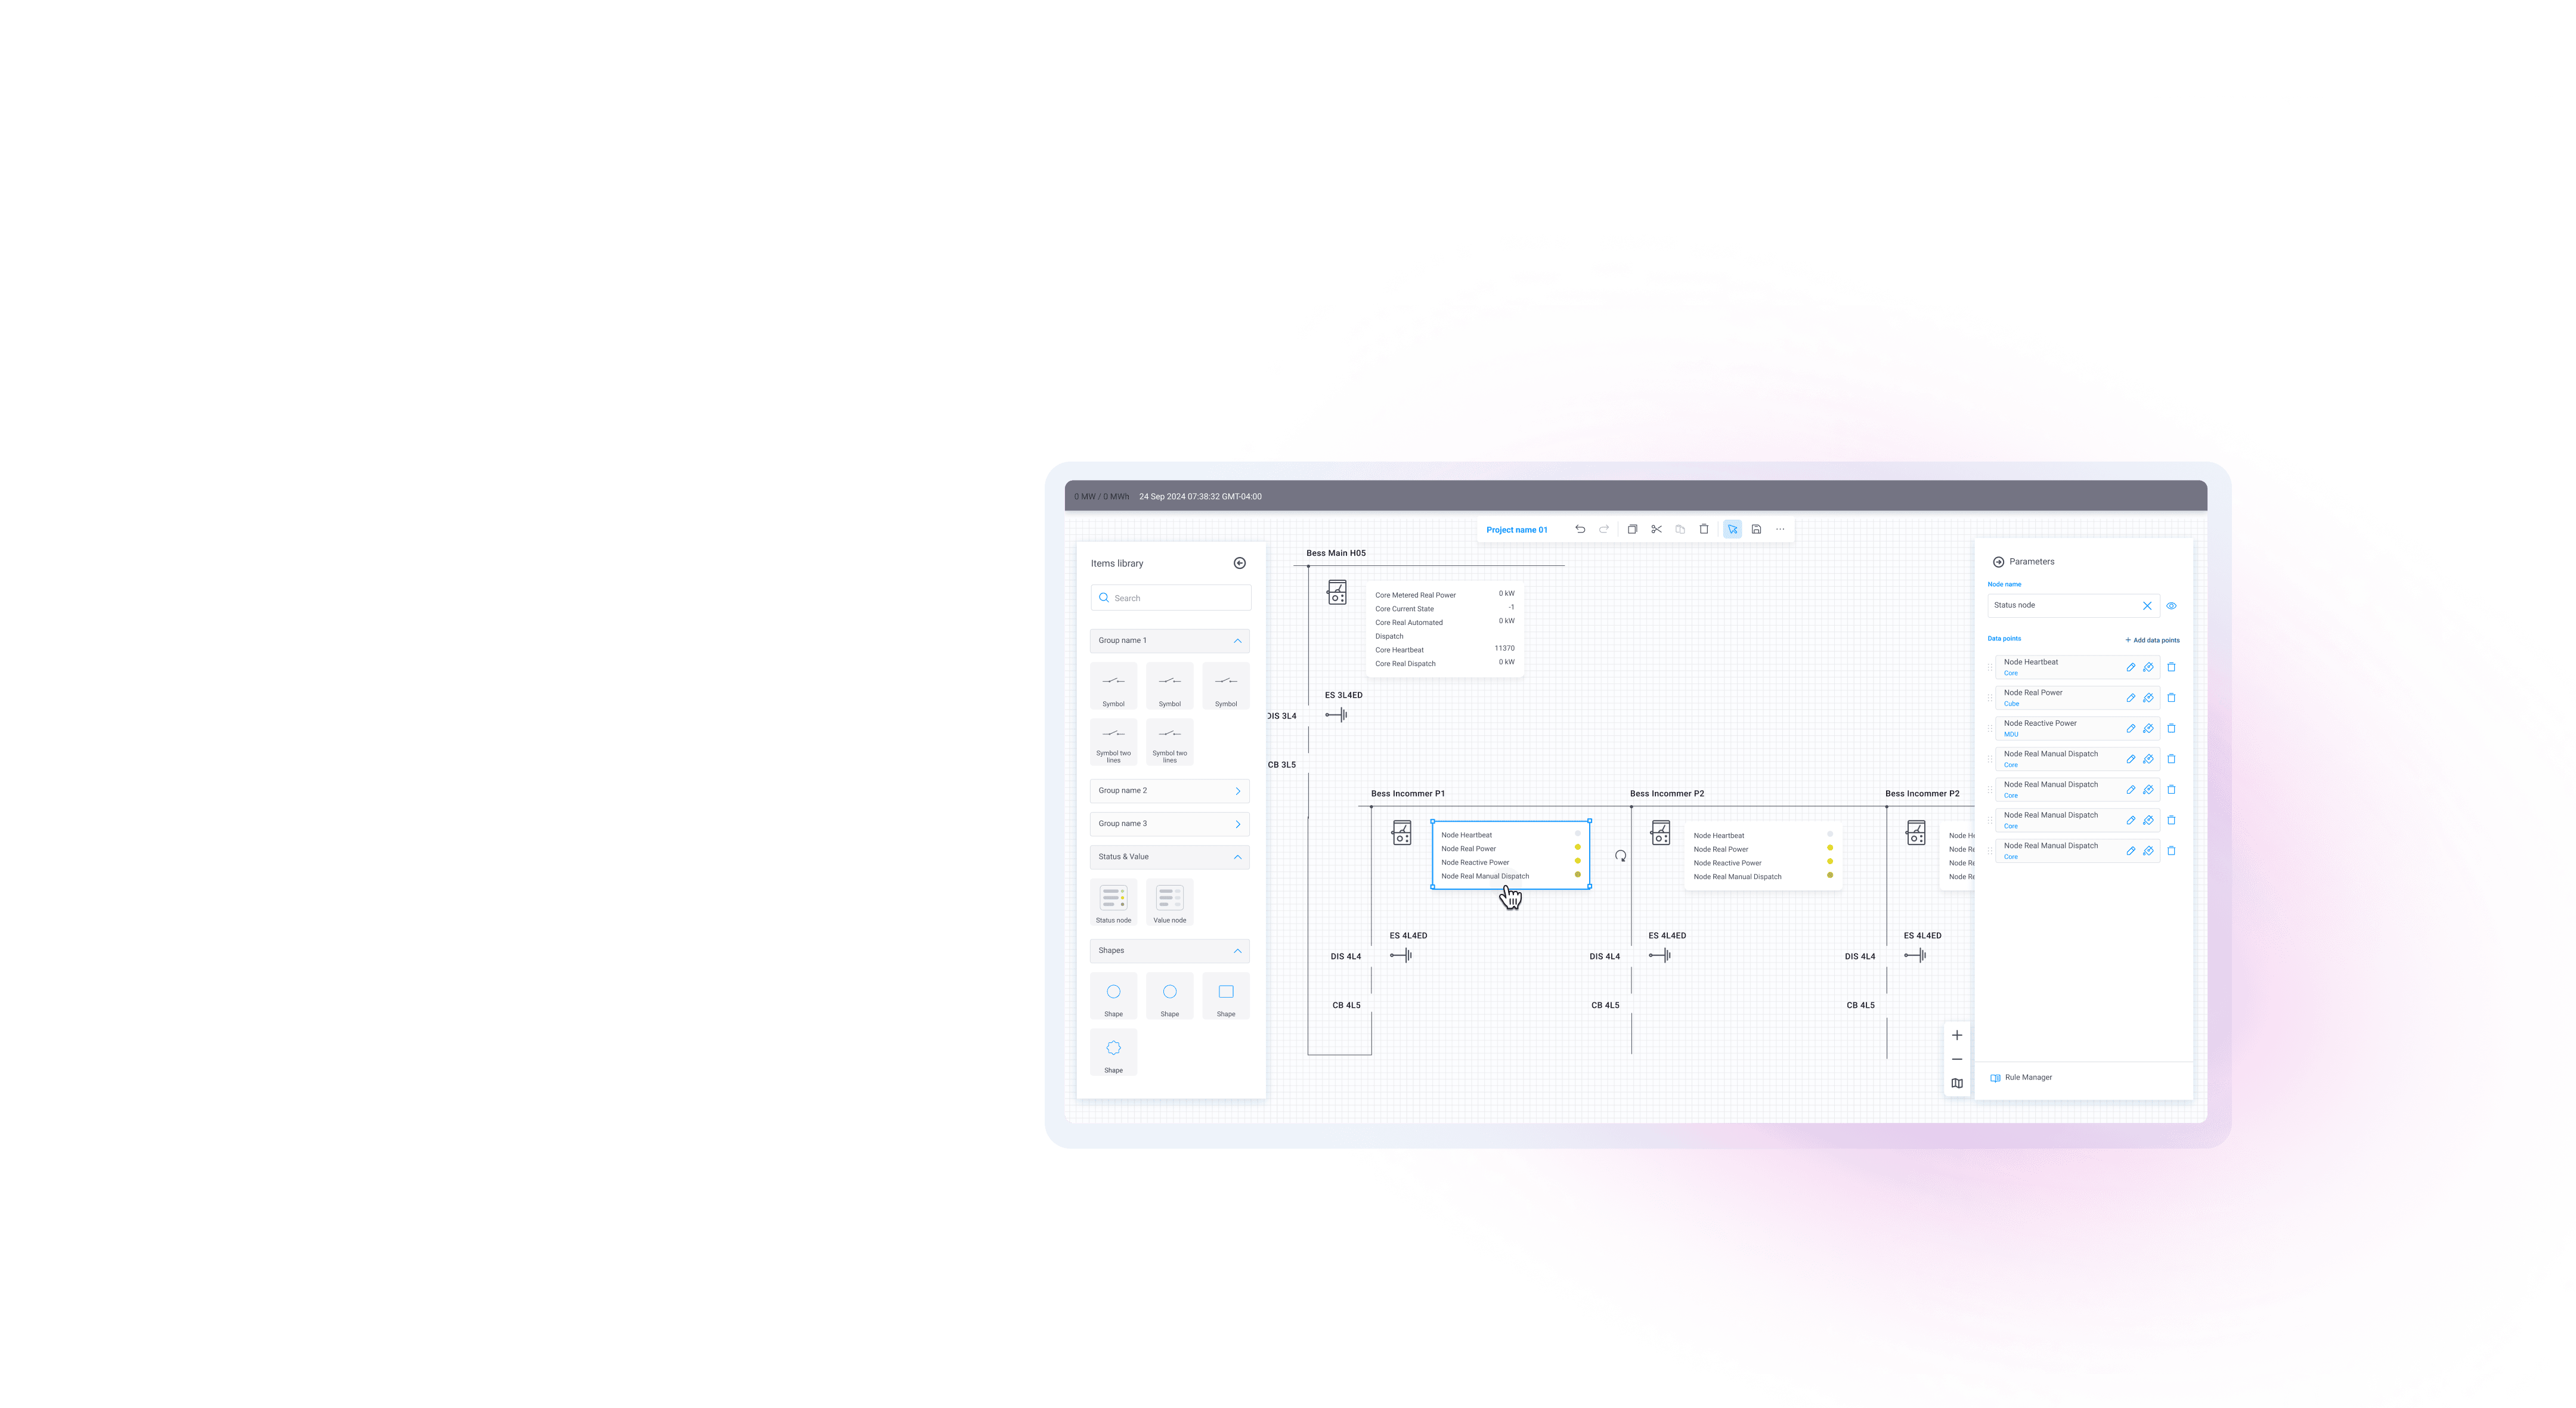
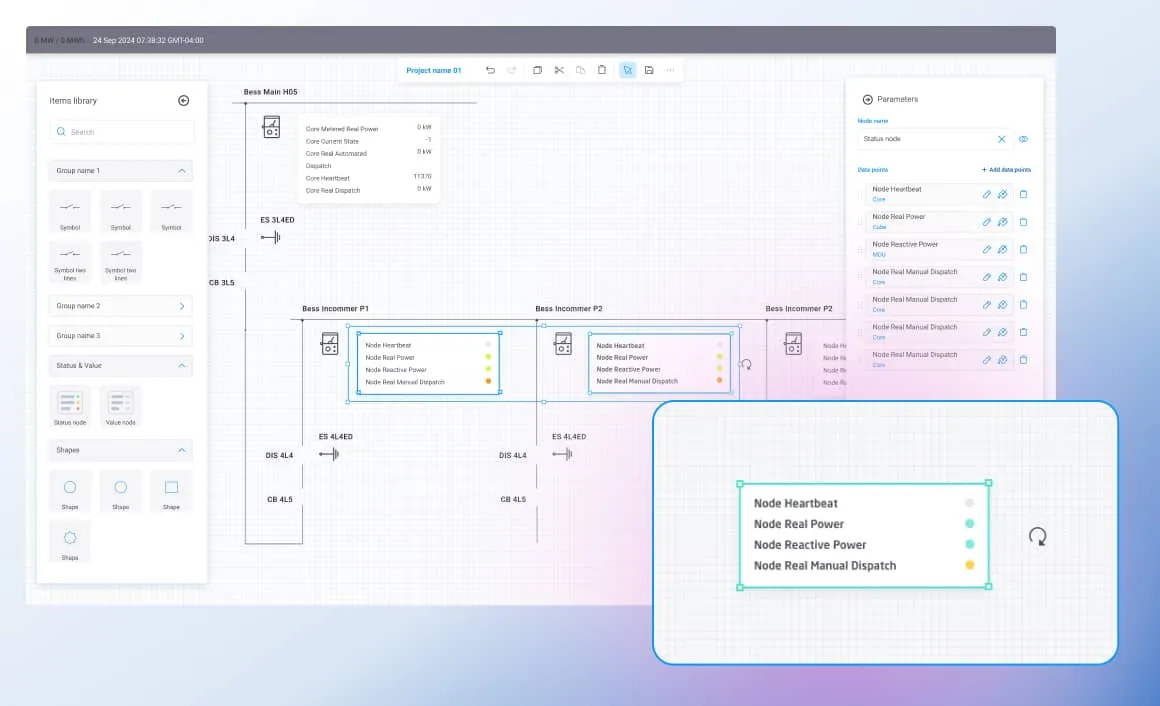
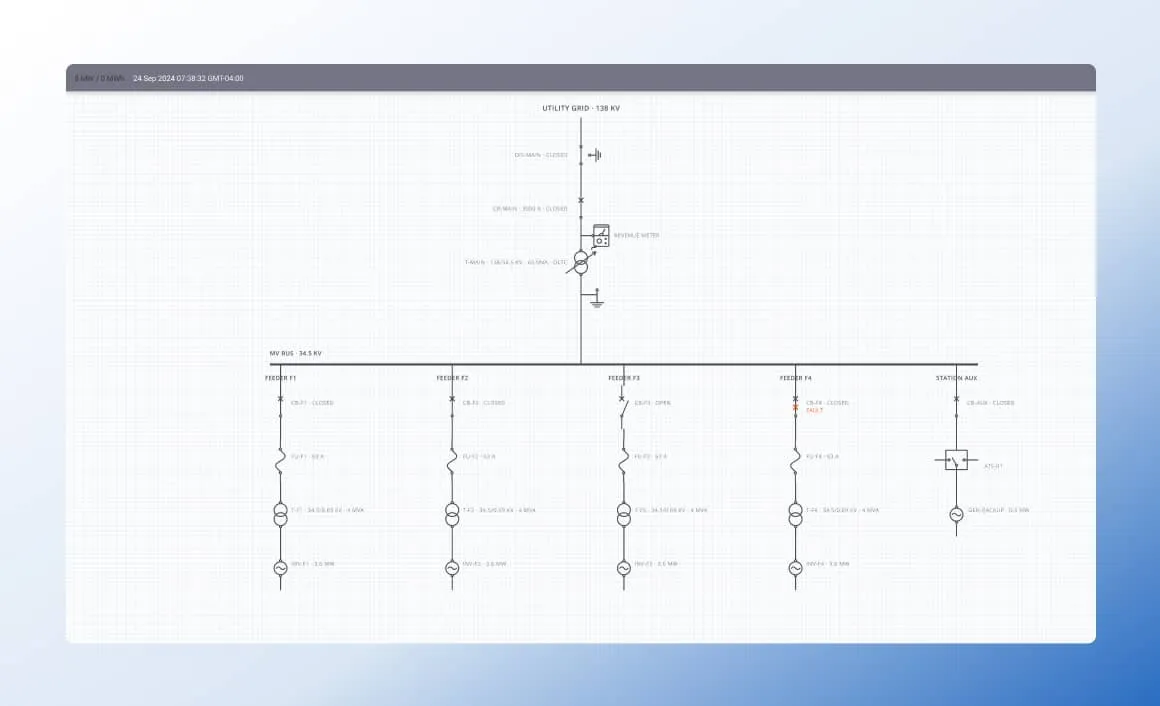
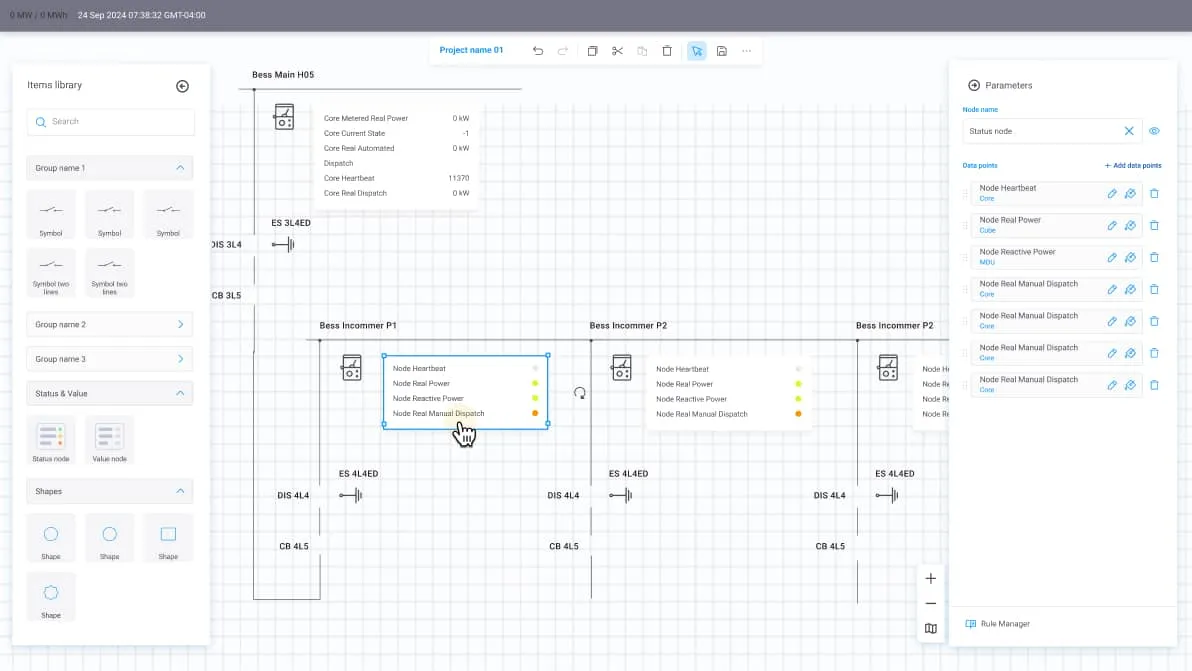
Every operator is empowered to build, edit, and reorganize complex electrical diagrams visually – no developer support or specialist training needed. Intuitive interface with rotation, line breaking, and multi-select for rapid workflow.
Live data overlays for electrical system monitoring
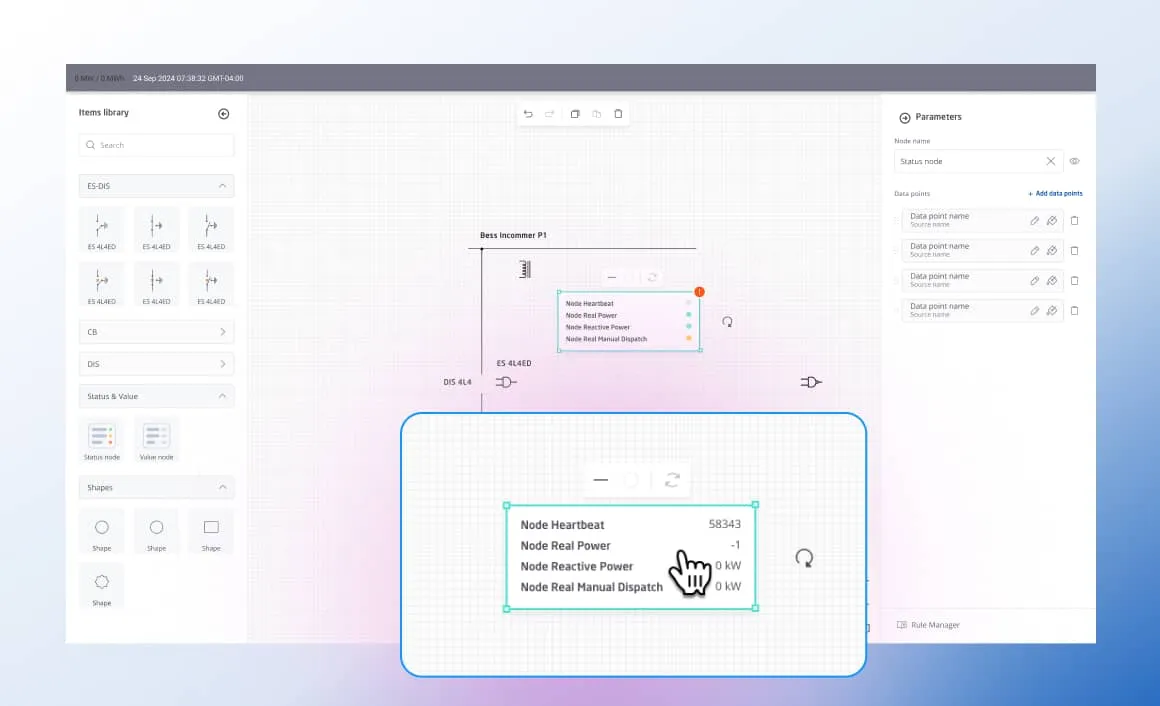
Diagrams display real-time values (voltage, SoC, frequency) and system status. Operators see the current state of the plant, enabling instant, data-driven decisions and proactive electrical system management.
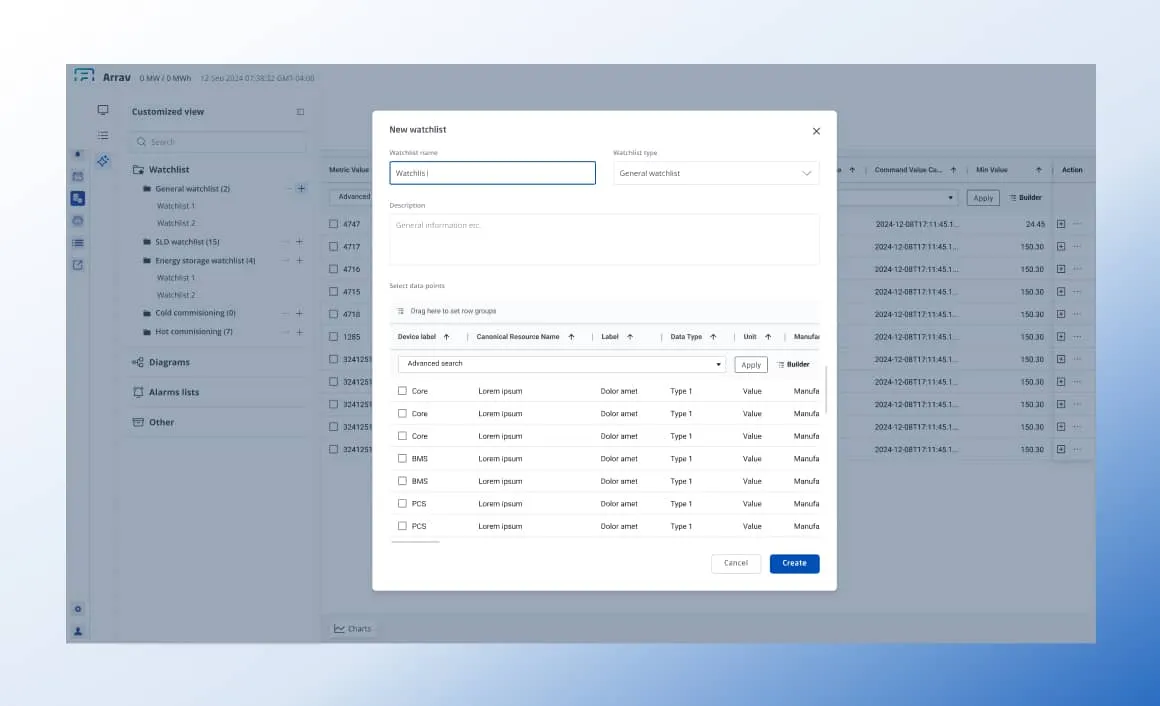
Personalized views and asset watchlists
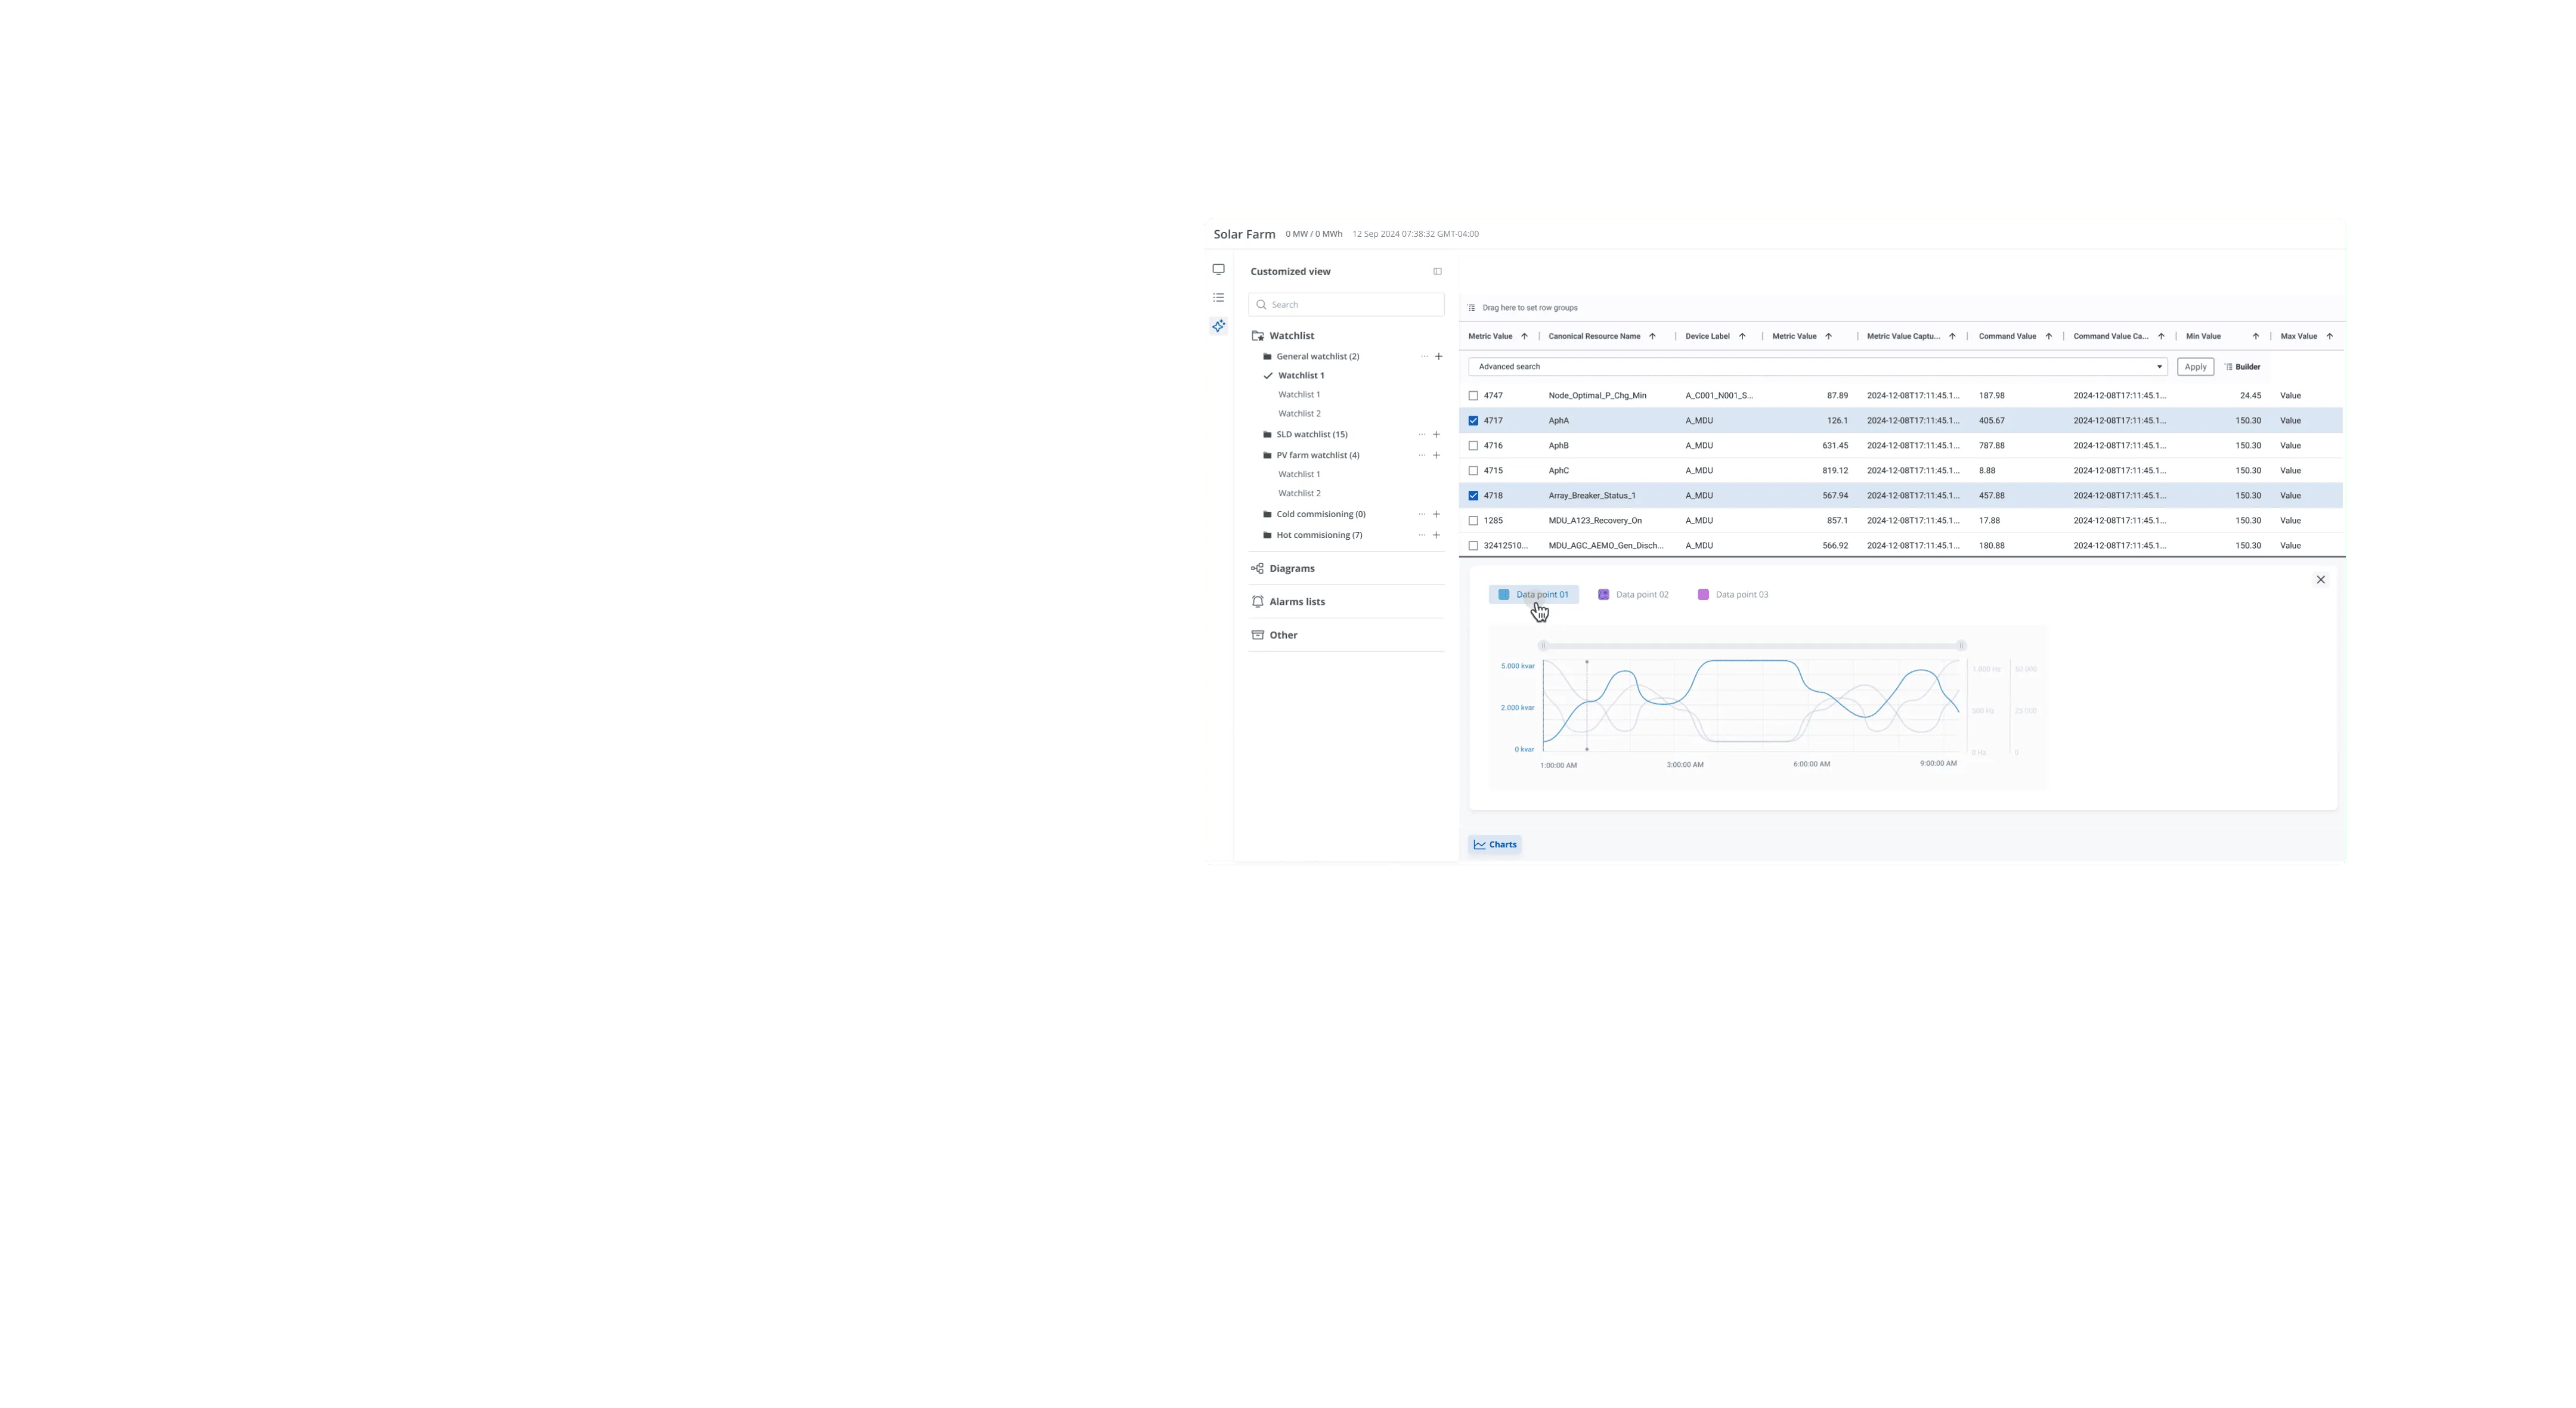
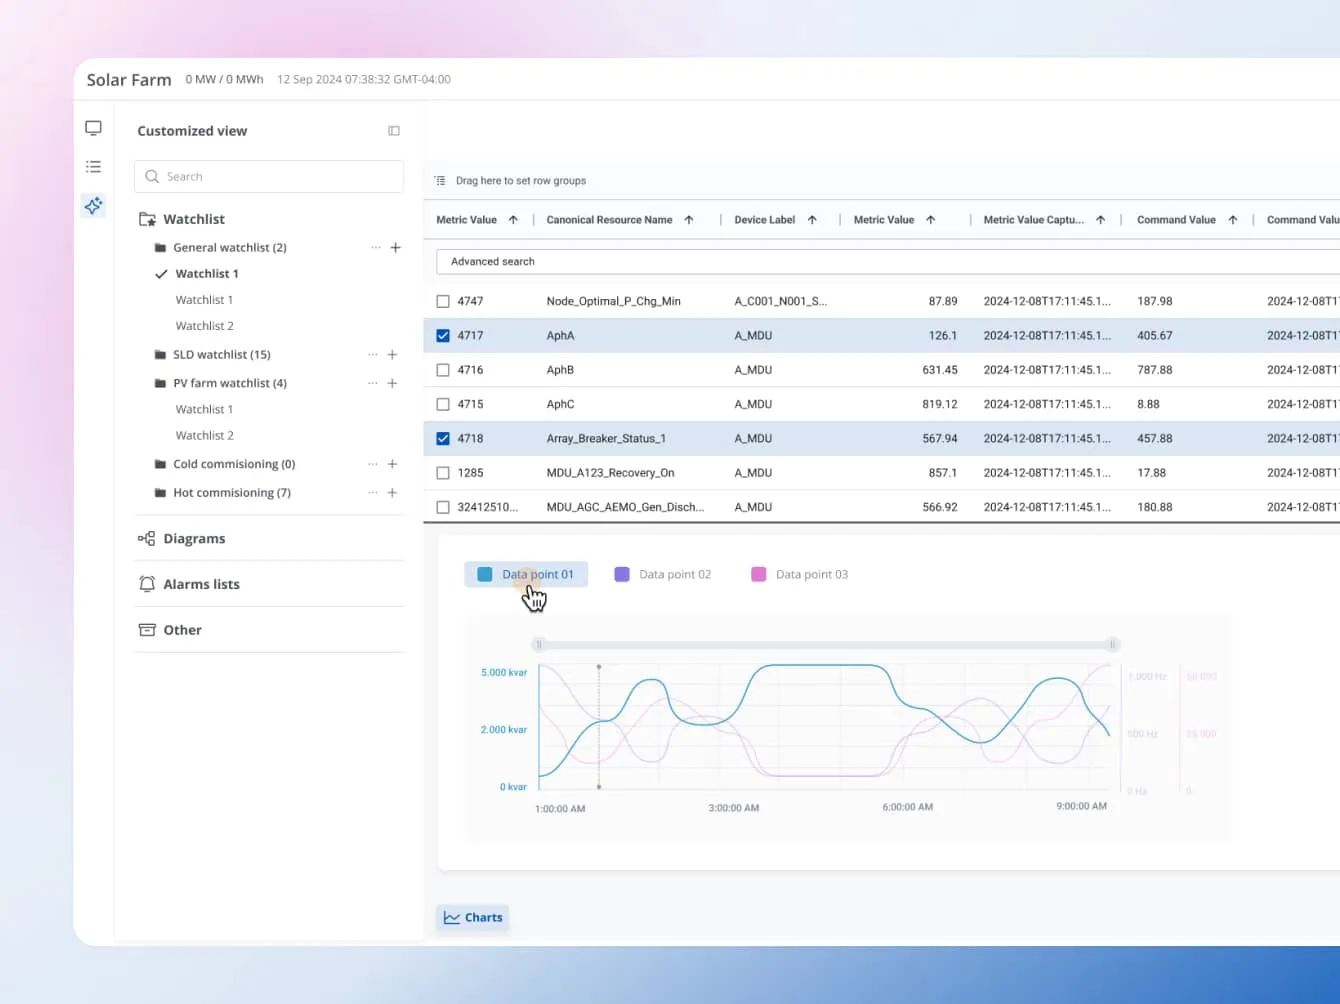
Operators create custom pages and watchlists for specific assets or sites. Filter, export, and monitor what matters most – tailored to every plant’s unique electrical network.
System reliability and automation for large-scale electrical engineering
Rules that react to live data. Integrated with the plant systems already in place.
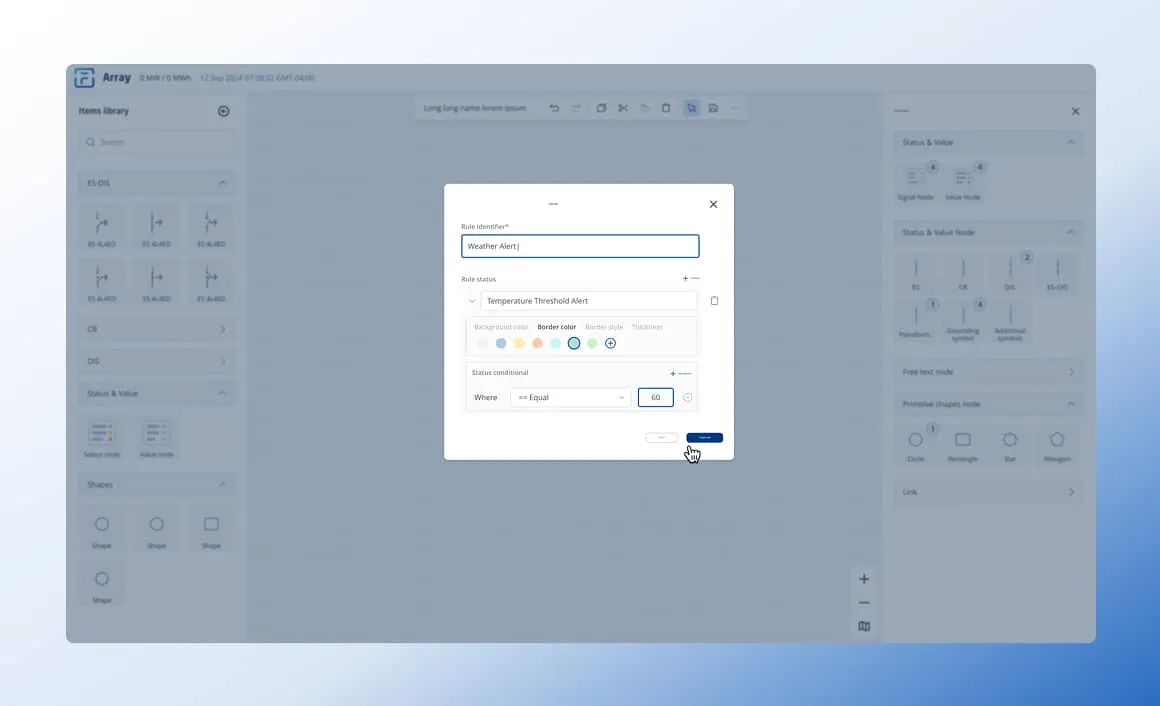
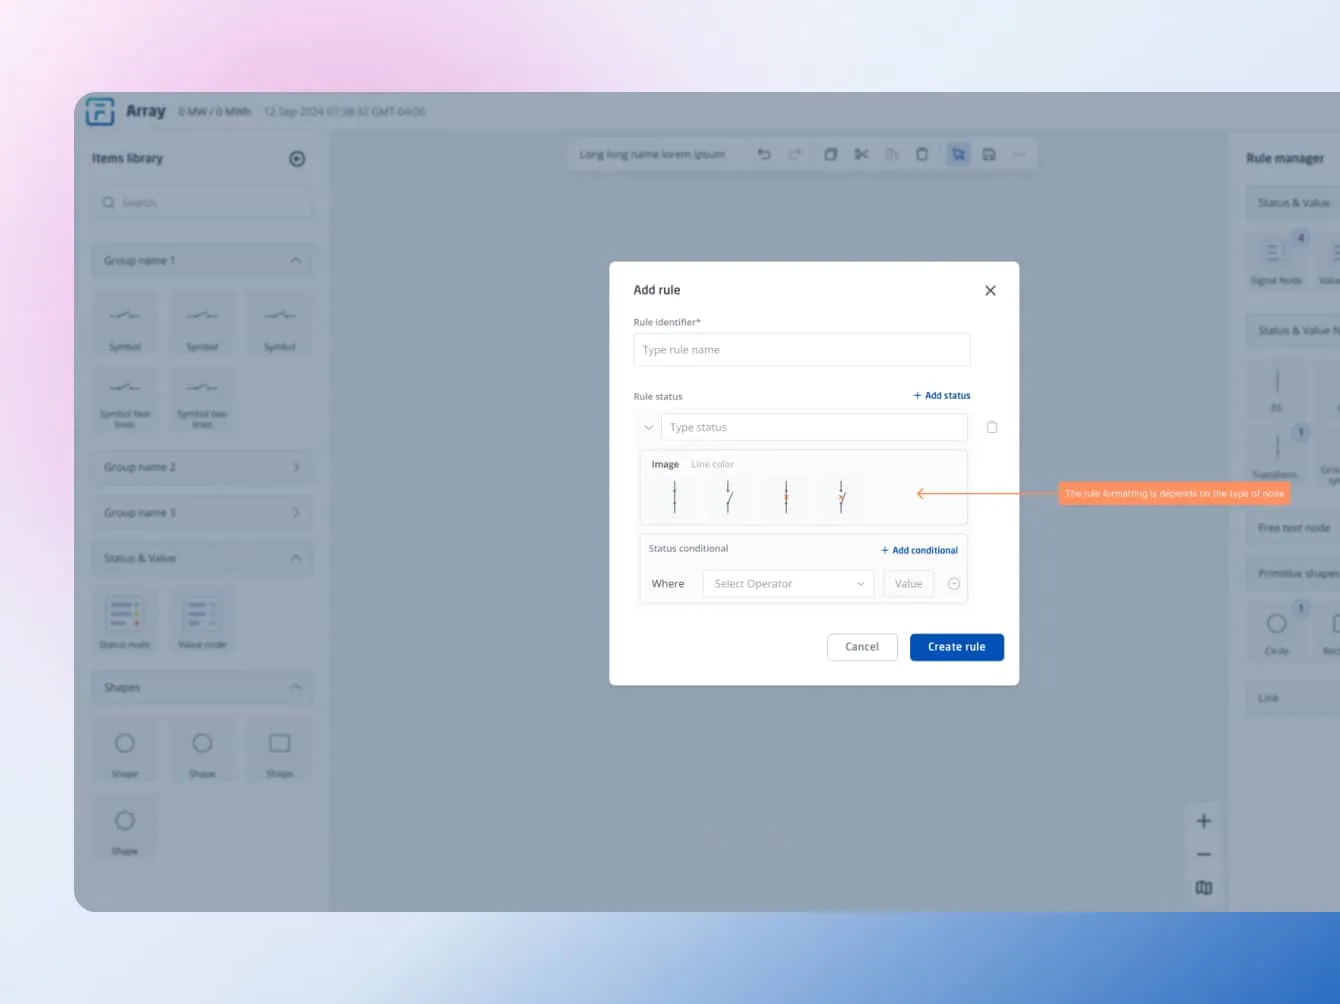
Custom rule manager and automated alerts
Operators can define custom rules for any monitored parameter – trigger alerts, automate workflows, and ensure proactive maintenance. Operators stay ahead of issues and maintain compliance with electrical safety standards.
Scalability for complex power systems
Handles hundreds or thousands of diagram elements without performance loss. Built for the largest, most demanding electrical engineering and energy sector environments.
Seamless backend integration for data consistency
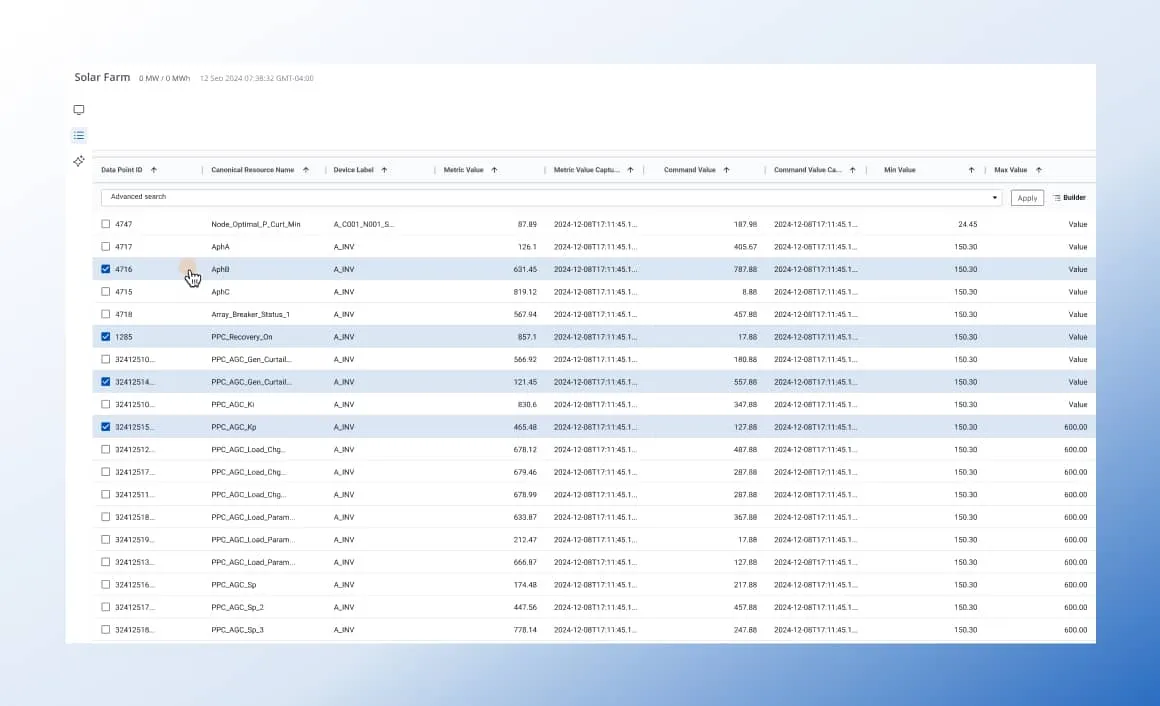
Direct connection to Fluence’s control systems ensures data consistency, security, and operational reliability. Without manual syncing or data silos – electrical engineering software works in harmony with existing infrastructure.
Every reading. Every element. Every second.
Sensor data streams directly into the diagram via WebSocket – voltage, SoC, frequency – updating every element continuously. No refreshing, polling interval, or gap between what's happening on site and what operators see on screen.
Set it once. Let the diagram react.
Operators define conditions – thresholds, states, parameter combinations – and the diagram responds automatically: changing colors, updating symbols, triggering alerts. One rule replaces hours of manual monitoring. The system acts before the operator has to.
Planning a similar project?
Let's talk about your challenges and goals.
The new operator-first and data-driven standard for diagram management
Now Fluence’s engineers and operators can update diagrams and monitor live plant data instantly. The platform reduced IT workload, improved safety, and enabled rapid adaptation to new sites – setting a new standard for electrical system management.
Why this digital transformation succeeded where others stalled

Platform designed specifically for diagram editing, real-time plant monitoring, and BESS operations.

The solution handled hundreds of diagram elements and integrated with existing control systems, ensuring reliability and future extensibility.

Synergy Codes brings years of experience in electrical engineering software, rapid prototyping, and iterative delivery – finishing within schedule and budget.
The real-time WebSocket integration and the Rules Manager were game changers. Operators can now define rules that automatically change diagram states based on live sensor data – it's not just visualization anymore, it's an active control layer. Synergy Codes made that possible.

FAQ
- What is a electrical diagram editor and why do plant operators need one?
Electrical diagram editor is a browser-based tool that lets domain experts – not only software developers – create, update, and interact with the technical diagrams they use to run a plant. In practice, that covers single line diagrams (the schematics showing how power flows), alarm views, and plant-wide dashboards. Without one, every diagram change waits for a developer. With one, operators control their own visualizations in real time.
- How can BESS operators update electrical diagrams without a developer?
Through a drag-and-drop editing interface. Elements can be rotated, snapped, connected, and multi-selected in the browser – no code, no ticket to engineering. For Fluence, that meant operators could reconfigure a plant's diagram in the same session as commissioning, cutting cycles from days or weeks down to minutes. The specific interactions available depend on what each team actually needs.
- How does real-time data connect to plant diagrams?
Through a WebSocket stream between the plant's control systems and the browser. As sensors read voltage, state of charge, frequency, or other parameters, each diagram element updates continuously – no refresh, no polling gap between what's happening on site and what operators see on screen. Combined with a rules engine, a static diagram becomes an active view: color changes on threshold breaches, alerts, and state transitions triggered by live conditions.
- Is custom electrical drawing software an alternative to EPLAN, ETAP, or AutoCAD Electrical?
Yes – but not a like-for-like replacement. EPLAN, ETAP, and AutoCAD Electrical solve specific parts of the engineering stack: schematics, simulation, CAD drafting. Custom electrical software bridges the gaps they leave – workflows specific to your team's standards, data flowing between disconnected tools, validation rules unique to your products. Most teams keep their existing stack and add custom software where the gaps are biggest.
- How long does it take to onboard a new plant with a custom diagram editor?
With a pre-built diagram editor as the foundation, a new BESS plant can go from initial configuration to operational visualization in hours instead of weeks. The historical bottleneck – every new site requiring custom code changes to represent its unique diagrams – disappears once the operations team can configure diagrams themselves. That's what changed for Fluence: onboarding shifted from a development project to an operations task.
- Can a diagram editor be tailored to specific plant standards and workflows?
Yes – and it usually should be. Every operations team runs different equipment, follows different safety standards, integrates with different backend systems, and has different workflows. A serious diagram editor is built around those specifics, not against a generic template. For Fluence, that meant integrating with their control systems and matching how their engineers actually work. For a different team, the feature set and integrations would look different.
- Is there a way to try electrical diagram editor before committing to a custom project?
Yes. Synergy Codes maintains a working SLD editor demo – a live, browser-based one where you can drag and drop electrical components, wire connections, and interact with a real diagramming canvas. No signup, no download.
- How does Synergy Codes approach building custom electrical diagram editors?
Every project starts with the team's actual workflow – what operators do, what standards they follow, what systems they integrate with. From there, the editor is built on a proven foundation and shaped to fit. That's the core of Synergy Codes' electrical design software services – custom builds around your standards, not against someone else's template. Learn more