Data visualization for advanced BI and analytics products that power data-driven teams 

Explore how we enhance products, simplify operations and support some of the world's most demanding organizations

100+
clients, from startups
to established SaaS companies

We support businesses of all sizes across automotive, gas and oil, big data, finance, technology and more

170+
successful projects

With our data visualization, UX/UI, and product development expertise, we elevate clients’ software UI and performance

12
years in the data visualization market

We stay ahead of data viz trends and work with top technology partners, so you get the most out of your data

Client success stories

Oops, no items found.

Gain real-time operational insight with a custom P&ID software

Create your refinery scheme, including flows, models, and logistics, using P&ID objects and links. Take advantage of premade set of reusable features and shorten your software’s time to market.

Case Study

Accessibility-first workflow builder that meets WCAG 2.1 standards

See how you can transform your workflow visualization tool into a fully accessible, scalable, and user-friendly data visualization solution - without sacrificing usability or speed.

Custom diagram interface with tldraw: Real-time and scalable

Discover how we built a collaborative tldraw-based diagram editor for structured data with custom logic, auto-layout, and real-time features.

Case Study

A no-code, drag-and-drop solution for visualizing and mapping complex service flows

Explore a drag and drop flow builder to enable end users creating service flow mappings and step-by-step guides.

Case Study

Optimizing diagram performance for global insurance sector

Learn how we enhanced GoJS diagrams, improving layout precision, export reliability, and user interface performance for the global insurance sector.

Modeling call flow diagram for better customer service

Look at how we simplified a call flow with a simple flow diagram that leads a user through a conversation step by step. Check out this solution for processes improvement in contact center.

Case Study

Transforming legal entity diagrams for better performance and clarity

Discover how Klea, an AI-driven legal tech platform, revitalized its Group Chart with Synergy Codes, enhancing performance, clarity, and scalability.

Real-time collaboration experience for better communication

Look how we increased user experience by enabling real-time collaboration module for software development tool.

Industrial IoT dashboards to enable smart manufacturing

Get real-time data from your IoT sensors and add value to day‑to‑day operations with the industrial IoT Dashboards

Visualizing the IoT sensors data on hydroponic farm

A visual tool that allows the users to monitor and plan works in the area of a hydroponic farm.

White Dribbble logo

Get inspired by over 70 Dribbble shots of our interactive data visualizations

Go to Dribbble
Graphic encouraging users to get inspired by examples of interactive data visualizations, featuring a variety of user interfaces with more posted on Dribbble.

What our clients say about us

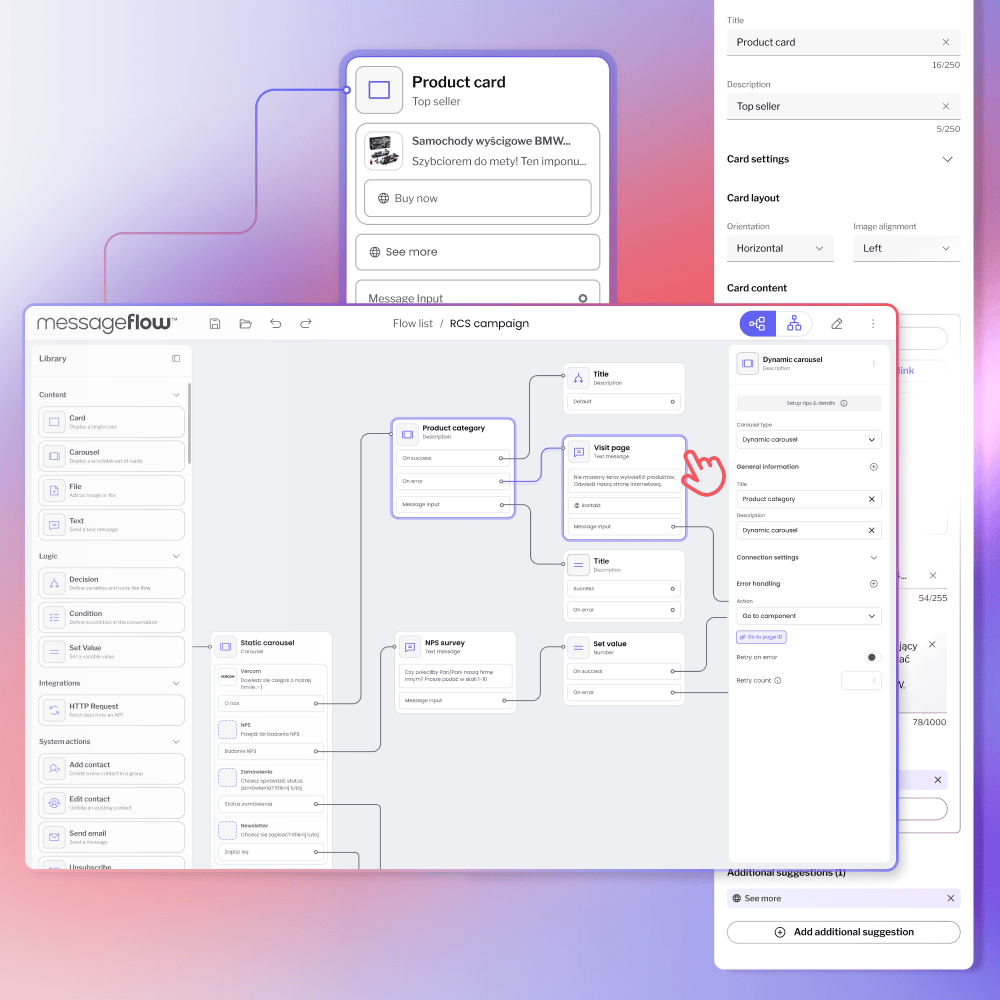
Synergy Codes experts are unparalleled in creating visual collaborative apps, making them the top choice in the market. Their knowledge, professionalism, and how they leverage the Yjs library left me really impressed.

Profile picture of Kevin Jahs, CEO of Yjs with long brown hair and beard.
Kevin Jahs
CEO, Yjs

Synergy Codes is at the top of the charts regarding timeliness, accuracy, completeness, and budget compliance.

Profile image of Robert Scott, CTO & Co-Founder of EON Collectiv wearing red shirt and black jacket.
Robert Scott
CTO & Co-Founder, EON Collectiv

Find out how we can improve your data software with data visualizations

We’re here to enhance your software UI and performance with consulting, product design and development services.

Book a 1-on-1 consultation