Large graph visualization in JavaScript: which libraries can handle thousands of nodes?

A library that displays 20,000 lightweight points may still struggle with 2,000 complex nodes. Match the JavaScript graph library to your real workload.
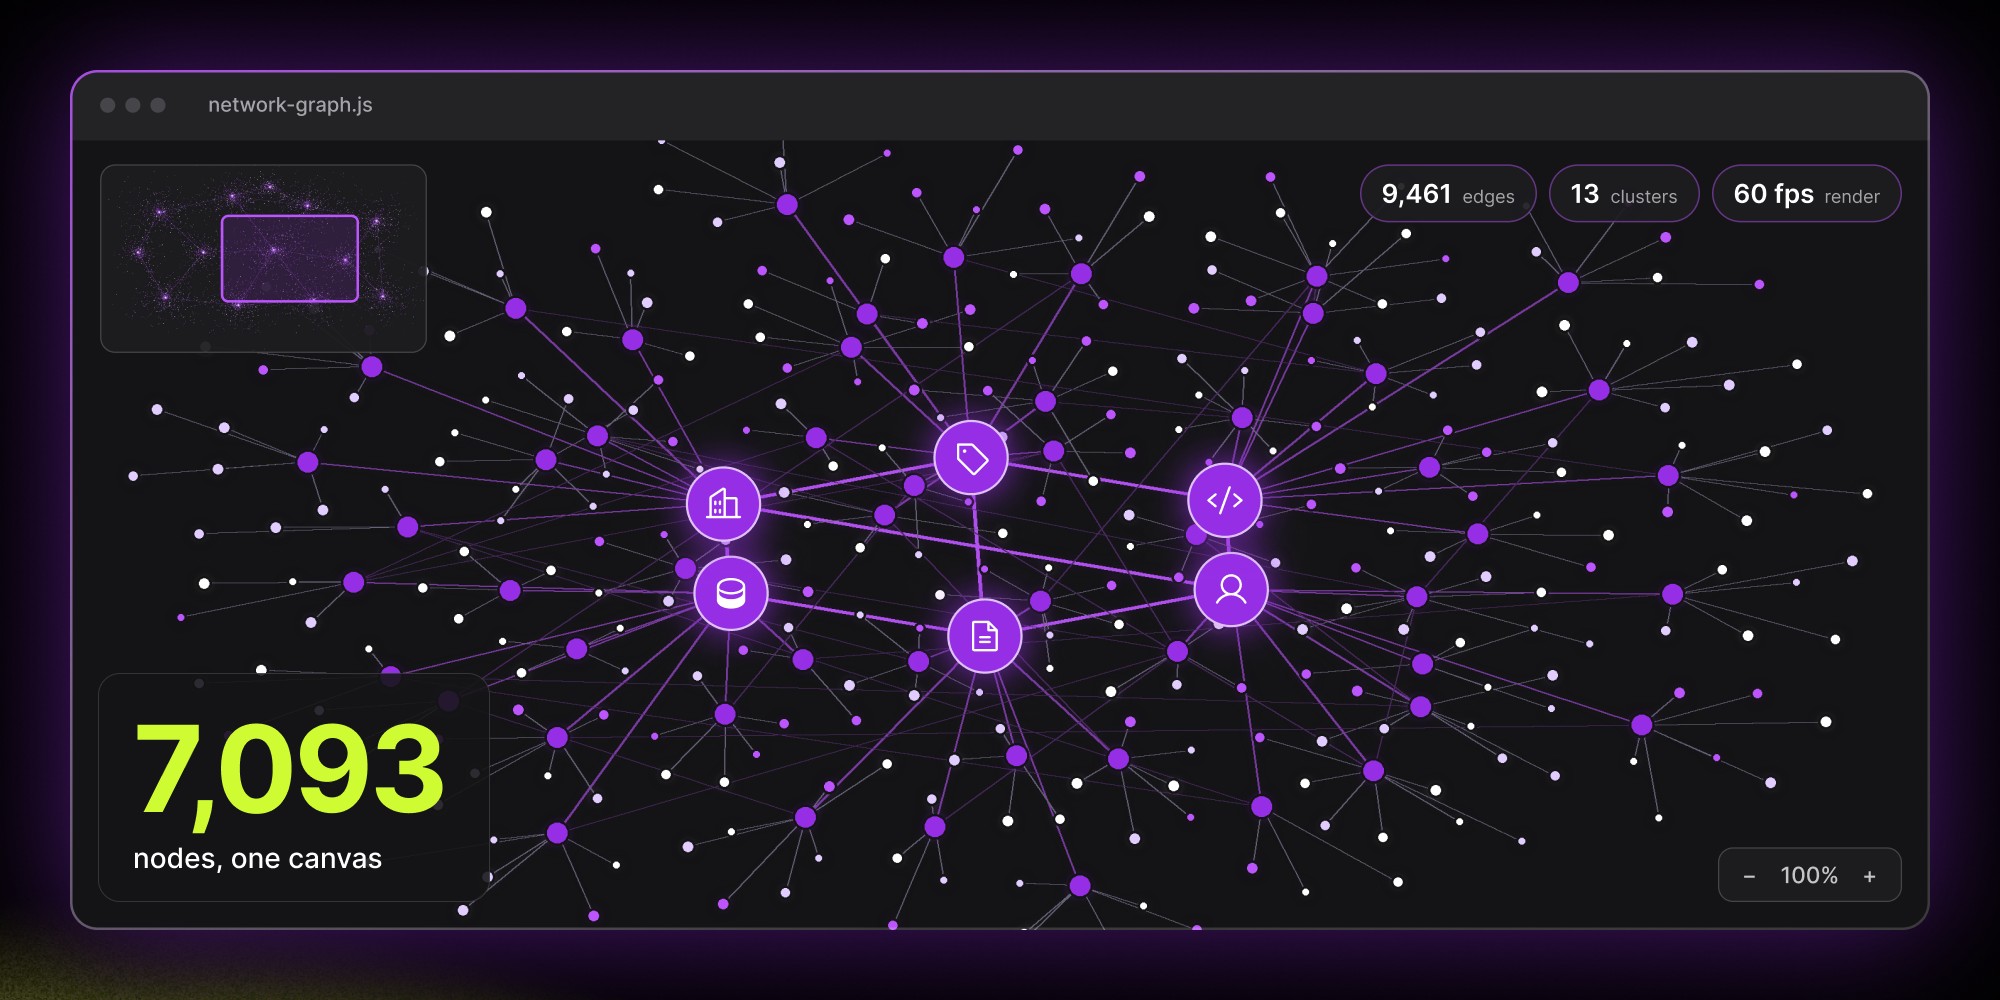
Large graph visualization depends on rendering model and node complexity more than node count. React Flow suits rich React editors, JointJS and GoJS suit large editable diagrams, and Sigma.js uses WebGL for tens of thousands of lightweight elements. In a Synergy Codes benchmark, React Flow loaded 10,000 nodes faster, but JointJS kept interaction smoother.
A graph with 80 nodes makes almost any JavaScript visualization library look fast. Add 8,000 nodes, thousands of edges, live updates, labels, selection states, and user interaction, and the technology underneath suddenly matters more.
Large graph visualization is less about finding a library with a high node-count claim and more about matching the rendering model to what users actually need to do with the graph. A library that comfortably displays 20,000 lightweight points may struggle with 2,000 complex interactive nodes. Layout calculations can also become the bottleneck before rendering does.
For JavaScript applications working at this scale, libraries such as React Flow, JointJS, GoJS, Cytoscape.js, Sigma.js, and yFiles deserve consideration. They solve different parts of the problem, so the useful comparison starts with scale, interactivity, and node complexity rather than a single benchmark.
What counts as a large graph?
There isn't one useful threshold.
1,000 nodes can already be a large diagram if every node contains forms, charts, status indicators, and other interactive UI. 10,000 lightweight network nodes rendered through WebGL may be considerably easier to display.
Instead of asking only "How many nodes does this library support?", look at the whole workload:
- Number of visible nodes
- Number and density of edges
- Complexity of each node
- Frequency of updates
- Layout calculations
- Amount of user interaction
The final point is particularly easy to underestimate. Rendering a graph once and letting someone zoom around it is different from allowing users to drag nodes, reconnect edges, edit data, and receive live updates while the graph stays responsive.
A practical node-count ladder
Exact limits depend on the application, but thinking in ranges is useful during architecture discussions.
Under 500 nodes: most mature libraries are comfortable
At this size, library choice is usually driven by product requirements rather than raw rendering performance.
A workflow editor may benefit from React Flow's native React nodes. A network visualization could use Cytoscape.js. A diagram-heavy enterprise application might already justify GoJS or JointJS because of the editor functionality around the graph.
Performance testing still matters when individual nodes are unusually complex, but the renderer usually isn't the first architectural constraint.
500–2,000 nodes: implementation choices start to show
Moving into the low thousands exposes inefficient state updates and expensive custom components.
A React-based diagram may still perform well, but re-rendering hundreds of complex nodes because one value changed can create visible lag. Edge calculations and automatic layout can also start consuming noticeable time.
This range is where memoization, selective updates, and viewport-aware rendering stop being premature optimization and become normal diagram engineering.
2,000–10,000 nodes: rendering architecture becomes important
Synergy Codes tested React Flow and the JointJS React wrapper across graphs ranging from 100 to 50,000 nodes. React Flow produced faster initial rendering throughout the benchmark, including 4 seconds at 5,000 nodes and 9.7 seconds at 10,000. JointJS took considerably longer to load the same larger graphs, reaching 15 seconds at 5,000 nodes and 62 seconds at 10,000.
Interaction told a different story. In the same test, React Flow started losing smoothness around 2,000 to 3,000 nodes without aggressive optimization, while JointJS maintained more stable interaction performance on larger diagrams because rendering was handled outside React's lifecycle.
Those numbers belong to one controlled benchmark rather than a universal limit. The useful lesson is broader: initial load performance and interaction performance aren't the same metric.
10,000+ nodes: "diagram" and "graph visualization" start separating
At this scale, a product displaying thousands of relationships often benefits from a renderer designed specifically for dense graph visualization.
Sigma.js uses WebGL and describes itself as a library for graphs containing thousands of nodes and edges. Its rendering pipeline uses the GPU rather than creating one DOM component for every node.
A recent real-world engineering write-up describes using Sigma.js for an interactive 21,000-node graph after DOM-node rendering became impractical for that workload.
Research projects have pushed specialized WebGL graph renderers considerably further. NetV.js, for example, reported interactive rendering of up to 50,000 nodes and one million edges on commodity hardware in its published benchmark. Those numbers shouldn't be transferred directly to another application, but they show how far GPU-oriented visualization can move the ceiling compared with DOM-heavy editing interfaces.
Node count isn't the metric that breaks first
A product team can spend a lot of time debating 5,000 versus 10,000 nodes while overlooking what actually causes the interface to feel slow.
Several different systems are doing work whenever a graph changes.
Finding the real bottleneck is more useful than replacing the library because the node count looks scary.
See how Synergy Codes tuned GoJS diagram performance for insurance software
Read case study
HTML, SVG, Canvas, or WebGL?
Rendering technology influences where performance pressure appears.
HTML and React DOM
HTML nodes are extremely convenient when each graph element needs rich UI.
Forms, buttons, charts, menus, and existing design-system components can live inside a node without inventing another rendering layer. React Flow benefits heavily from this model.
The cost appears as node count grows. Thousands of interactive DOM elements create work for both the browser and React, particularly when state updates affect large parts of the component tree. This makes HTML-based diagramming attractive for rich editors with moderate graph size, not necessarily for huge relationship networks.
SVG
SVG is naturally suited to vector graphics and remains easy to inspect and style.
JointJS uses an SVG-oriented rendering engine separate from React, which helps keep diagram interaction outside the React component lifecycle. Synergy Codes' benchmark showed smoother runtime interactions for JointJS than React Flow at larger node counts, even though JointJS took longer to produce the initial render.
Large SVG scenes can still become expensive because thousands of objects remain part of the browser's scene graph.
Canvas
Canvas reduces the number of browser elements by drawing into one surface.
GoJS uses HTML5 Canvas, and Synergy Codes has used it successfully in applications displaying thousands of interactive objects. In one client proof of concept (PoC), the team compared GoJS with JointJS+ for 10,000 diagram objects. GoJS rendered the tested diagram faster and maintained roughly 60 FPS in the reported scenario.
Canvas gives the rendering engine more control, although building rich HTML-like interfaces inside individual nodes can require a different development model.
WebGL
WebGL moves much of the graphics workload to the GPU and is particularly useful when the product needs to visualize a very large number of relatively lightweight graph elements.
Sigma.js follows this model and targets large graph visualization rather than form-heavy workflow editing. Current Sigma.js documentation describes its WebGL renderer as designed for smooth performance with tens of thousands of graph elements.
WebGL isn't automatically better for every diagram, though.
Rendering 50,000 circles efficiently doesn't mean WebGL provides the best environment for a workflow editor where every node contains several React controls.
Which JavaScript libraries are worth testing for large graphs?
No single library covers every type of large graph application.
React Flow
React Flow remains attractive when nodes need rich React UI and the application is fundamentally an editor.
Its strongest use cases include workflow builders, node-based configuration tools, and products where nodes behave like small application components rather than simple graph vertices.
Large graphs require careful optimization. Synergy Codes' benchmark showed faster initial loading than JointJS across all tested sizes, while interaction became increasingly sensitive to the size of the React tree.
Ourhttps://www.synergycodes.com/blog/react-flow-performance https://www.synergycodes.com/blog/react-flow-performanceReact Flow performance guide covers the optimization side in more detail.
JointJS
JointJS uses its own diagram engine rather than rendering the graph entirely through React.
That can provide steadier interactions on larger editable diagrams. The trade-off shown in Synergy Codes' benchmark was slower initial rendering as graph size increased.
For applications sitting between a rich editor and a large technical diagram, JointJS deserves a realistic prototype rather than a decision based only on framework preference.
The full React Flow vs JointJS React wrapper comparison includes the benchmark methodology and implementation differences.
GoJS
GoJS is a mature commercial diagramming library using Canvas rendering.
Synergy Codes has used GoJS for interactive industrial diagrams with thousands of objects and frequent data updates. One performance PoC used virtualization to keep visible objects active while avoiding unnecessary work for off-screen elements.
That makes GoJS particularly relevant for large technical diagrams where users still need substantial editing and interaction.
Our older GoJS vs JointJS performance case is worth reviewing when this is the application profile.
Cytoscape.js
Cytoscape.js is built around graph visualization and analysis rather than a React-style workflow canvas.
It works well for relationship-heavy data such as networks, dependencies, biological graphs, and knowledge graphs. The library includes graph algorithms and an ecosystem of layout extensions.
For products where users mainly explore the graph rather than configure rich UI inside each node, the Cytoscape.js architecture can be a better fit than a DOM-heavy editor.
Sigma.js
Sigma.js is one of the clearest options when the requirement is simply large interactive graph visualization in the browser.
It uses WebGL and Graphology, keeping the rendering and graph-data concerns separate. The project explicitly targets graphs with thousands of nodes and edges.
Sigma.js becomes less obvious when every node needs forms, buttons, or complex embedded widgets. Its strength lies in high-performance graph exploration rather than recreating a React component tree on the GPU.
yFiles
yFiles sits at the commercial enterprise end of the category. Its breadth of graph layouts and visualization capabilities makes it relevant when scale is only one part of a larger set of demanding diagram requirements.
Teams considering yFiles should evaluate licensing alongside implementation needs because library cost becomes part of the architecture decision.
The large-graph bottleneck map
When a graph feels slow, we'd diagnose it in roughly this order.
Slow initial load?
Measure serialization, data preparation, layout, and rendering separately. A slow diagram may spend most of its startup time calculating positions before the renderer has drawn anything.
Smooth load, terrible dragging?
Look at interaction FPS and update propagation. React applications can accidentally re-render far more nodes than the one being moved. Memoization and smaller state subscriptions often have more impact here than changing layout algorithms.
Zooming becomes sluggish?
Check how many elements remain rendered outside the viewport. Viewport culling or virtualization can reduce the amount of active work dramatically.
Live data freezes the canvas?
Batch updates rather than applying every event directly to the diagram. Industrial monitoring applications are a good example. Synergy Codes' GoJS PoC used virtualization partly because new data arrived continuously through WebSocket while thousands of objects were present on the canvas.
Layout takes longer than rendering?
Move layout work off the main thread or calculate it less often. Complex force-directed layouts can become expensive even when the renderer itself could comfortably display the resulting graph.
Performance ladder: what we'd try before changing the library
Switching diagram technology can become a major rewrite, so it makes sense to exhaust the obvious architectural fixes first.
Level 1 → Stop unnecessary updates
Memoize expensive node components and subscribe only to the state each component actually needs.
Level 2 → Render less
Hide or simplify off-screen elements. Large graphs rarely need every detail visible at every zoom level.
Level 3 → Reduce visual complexity
A node shown at 20% zoom doesn't need the same labels, controls, and decorations as a node the user is actively editing.
Level 4 → Batch high-frequency changes
Live-data applications should avoid causing a render for every event arriving from the server.
Level 5 → Move expensive computation away from interaction
Layout calculations and graph analysis can often run in Web Workers or be cached.
Level 6 → Reconsider the renderer
Once the product has genuinely outgrown the rendering model, moving from DOM/SVG-heavy editing toward Canvas or WebGL can create a much larger performance ceiling.
Fix slow React Flow diagrams with a six-step performance guide
Get the ebook What virtualization changes
Virtualization is often described as a generic performance fix, but its value depends on the product.
The basic idea is simple: don't spend rendering resources on elements users can't currently see.
A graph may contain 20,000 objects while the viewport displays only several hundred. If the application can cheaply determine which elements are visible, the remainder can be simplified, frozen, or omitted from active rendering.
Synergy Codes used this technique in its shop-floor monitoring PoC, keeping visible data animated while avoiding equivalent work for objects outside the active canvas view.
Virtualization becomes harder when off-screen objects still affect layout or edge routing, so it needs to be designed around the graph model rather than added as a generic frontend trick.
Layout can become more expensive than drawing
Rendering gets most of the attention because users can see frame drops, but layout algorithms often become the hidden cost in large graphs.
Force-directed layouts may repeatedly calculate relationships across huge numbers of nodes. Hierarchical diagrams need to place levels and route connections without creating unnecessary overlap. Moving one node can potentially invalidate a large section of the layout.
For static graph exploration, calculating layout once and caching the positions may be enough. Editable products need a more incremental strategy. Large technical diagrams often benefit from limiting automatic layout to the affected region rather than recomputing the whole graph after every change.
Edge count can hurt more than node count
A 5,000-node sparse graph and a 5,000-node dense graph aren't remotely equivalent.
Edges add drawing work and often require additional interaction handling. In technical editors they may also need obstacle avoidance or orthogonal routing.
Dense networks can become visually unreadable before rendering itself fails. At that point, performance optimization alone isn't enough. Products may need clustering, aggregation, filtering, or level-of-detail behavior so users aren't asked to interpret every relationship at once.
Optimize the current library or switch?
Keep the current library when:
Performance problems come from avoidable re-renders, unbounded updates, expensive node components, or missing virtualization.
If profiling shows the renderer isn't the core problem, migration probably won't solve it.
Consider another rendering model when:
Your application needs an order of magnitude more visible elements than the current architecture comfortably supports, and those elements don't require rich DOM-based UI.
Moving from HTML-heavy rendering toward Canvas or WebGL makes more sense in that case.
Reconsider the product interaction when:
Users can't understand the graph even when it renders at 60 FPS.
At very large scales, filtering and progressive disclosure can matter more than adding another thousand nodes to the canvas.
How should you benchmark a large graph library?
Don't use the vendor's nicest demo. Build a test that resembles production.
Use realistic node complexity. Load the number of nodes and edges the product is expected to handle 2 years from now, not just at launch. Add the interactions people will actually perform.
Measure separately:
- Initial load time
- Interaction FPS
- Time to apply updates
- Memory usage
- Layout duration
- Performance while zooming or panning
Synergy Codes' React Flow vs JointJS comparison is useful because it measured both initial rendering and interaction FPS instead of collapsing performance into one number.
Don't benchmark an empty node
One of the easiest ways to get misleading results is to test thousands of placeholder rectangles when production nodes contain actual product UI.
A realistic node might include a status indicator, several labels, conditional styles, controls, and data coming from application state. In React, each of those pieces can participate in rendering.
Testing the simplified version may prove that the library can technically display 10,000 elements without proving that your product can.
The same applies to edges. Straight lines in a synthetic benchmark don't tell you how expensive custom routing or animated connections will become.
Which library can handle thousands of nodes?
Several JavaScript libraries can; they just handle different kinds of thousands.
- React Flow can work well for thousands of nodes when the product benefits from native React editing and the team invests in optimization.
- JointJS is worth testing for larger interactive diagrams where keeping rendering outside React can improve runtime stability.
- GoJS has a strong record in large editable Canvas-based diagrams and industrial visualization.
- Cytoscape.js fits graph exploration and analysis particularly well.
- Sigma.js becomes one of the clearest choices when the problem is visualizing tens of thousands of relatively lightweight graph elements through WebGL.
The useful decision isn't which library has the highest theoretical ceiling. It's which one reaches the scale your users need without forcing the rest of the product into an awkward architecture.
Synergy Codes works across JavaScript diagramming technologies and has already benchmarked several of these libraries under real application constraints. If an existing diagram is starting to slow down, a performance audit can also identify whether the real limitation sits in rendering, state architecture, layout, or something else before a team commits to a rewrite.
- Which JavaScript graph visualization library can handle thousands of nodes?
Several libraries can, but they handle different kinds of thousands. React Flow works for thousands of nodes when the product needs native React editing and the team invests in optimization, JointJS and GoJS suit larger editable diagrams, and Cytoscape.js fits graph exploration and analysis. Sigma.js is one of the clearest choices for tens of thousands of lightweight graph elements rendered through WebGL.
- How many nodes can React Flow handle?
In a Synergy Codes benchmark, React Flow rendered 5,000 nodes in 4 seconds and 10,000 nodes in 9.7 seconds, faster than the JointJS React wrapper at every tested size. Interaction started losing smoothness around 2,000 to 3,000 nodes without aggressive optimization. With memoization, selective updates, and viewport-aware rendering, React Flow can still work well for thousands of nodes.
- When should you use WebGL for graph visualization?
WebGL makes sense when the product needs to display a very large number of relatively lightweight graph elements that users explore rather than edit. Sigma.js uses WebGL and targets graphs with thousands of nodes and edges. WebGL is a weaker fit for workflow editors where every node contains forms or React controls.
- What slows down large graph visualization besides node count?
Large graphs usually slow down because of unnecessary React re-renders, dense edges, layout calculations, frequent live-data updates, hit testing, and thousands of labels. Layout can take longer than rendering, especially with force-directed algorithms. Measure initial load, interaction FPS, update time, memory usage, and layout duration separately to find the real bottleneck.
- How does virtualization improve large graph performance?
Virtualization skips rendering work for elements users can't currently see. A graph may contain 20,000 objects while the viewport displays only several hundred, so off-screen elements can be simplified, frozen, or omitted from active rendering. Synergy Codes used this technique in a GoJS proof of concept for shop-floor monitoring.
- Can Synergy Codes audit a slow diagram application?
Yes. Synergy Codes works across JavaScript diagramming technologies and has benchmarked several large graph libraries under real application constraints. A performance audit identifies whether the real limitation sits in rendering, state architecture, layout, or something else before a team commits to a rewrite.
Content Marketing Specialist who's spent the last decade making tech topics actually readable. With an MA in Brand Communication, Ida has crafted content strategies for several IT companies. Her portfolio spans from Kubernetes tutorials to enterprise software guides, now focusing on data visualization and diagramming solutions.

Find how we can help you enhance your software and win more deals
Contact us to discuss your project. After you submit the form, we’ll get in touch with you within 48 hours to arrange a call.