Best diagramming libraries for complex React applications

Most React diagram libraries look alike in screenshots. The differences show up once your app needs real editing, larger diagrams, and collaboration.
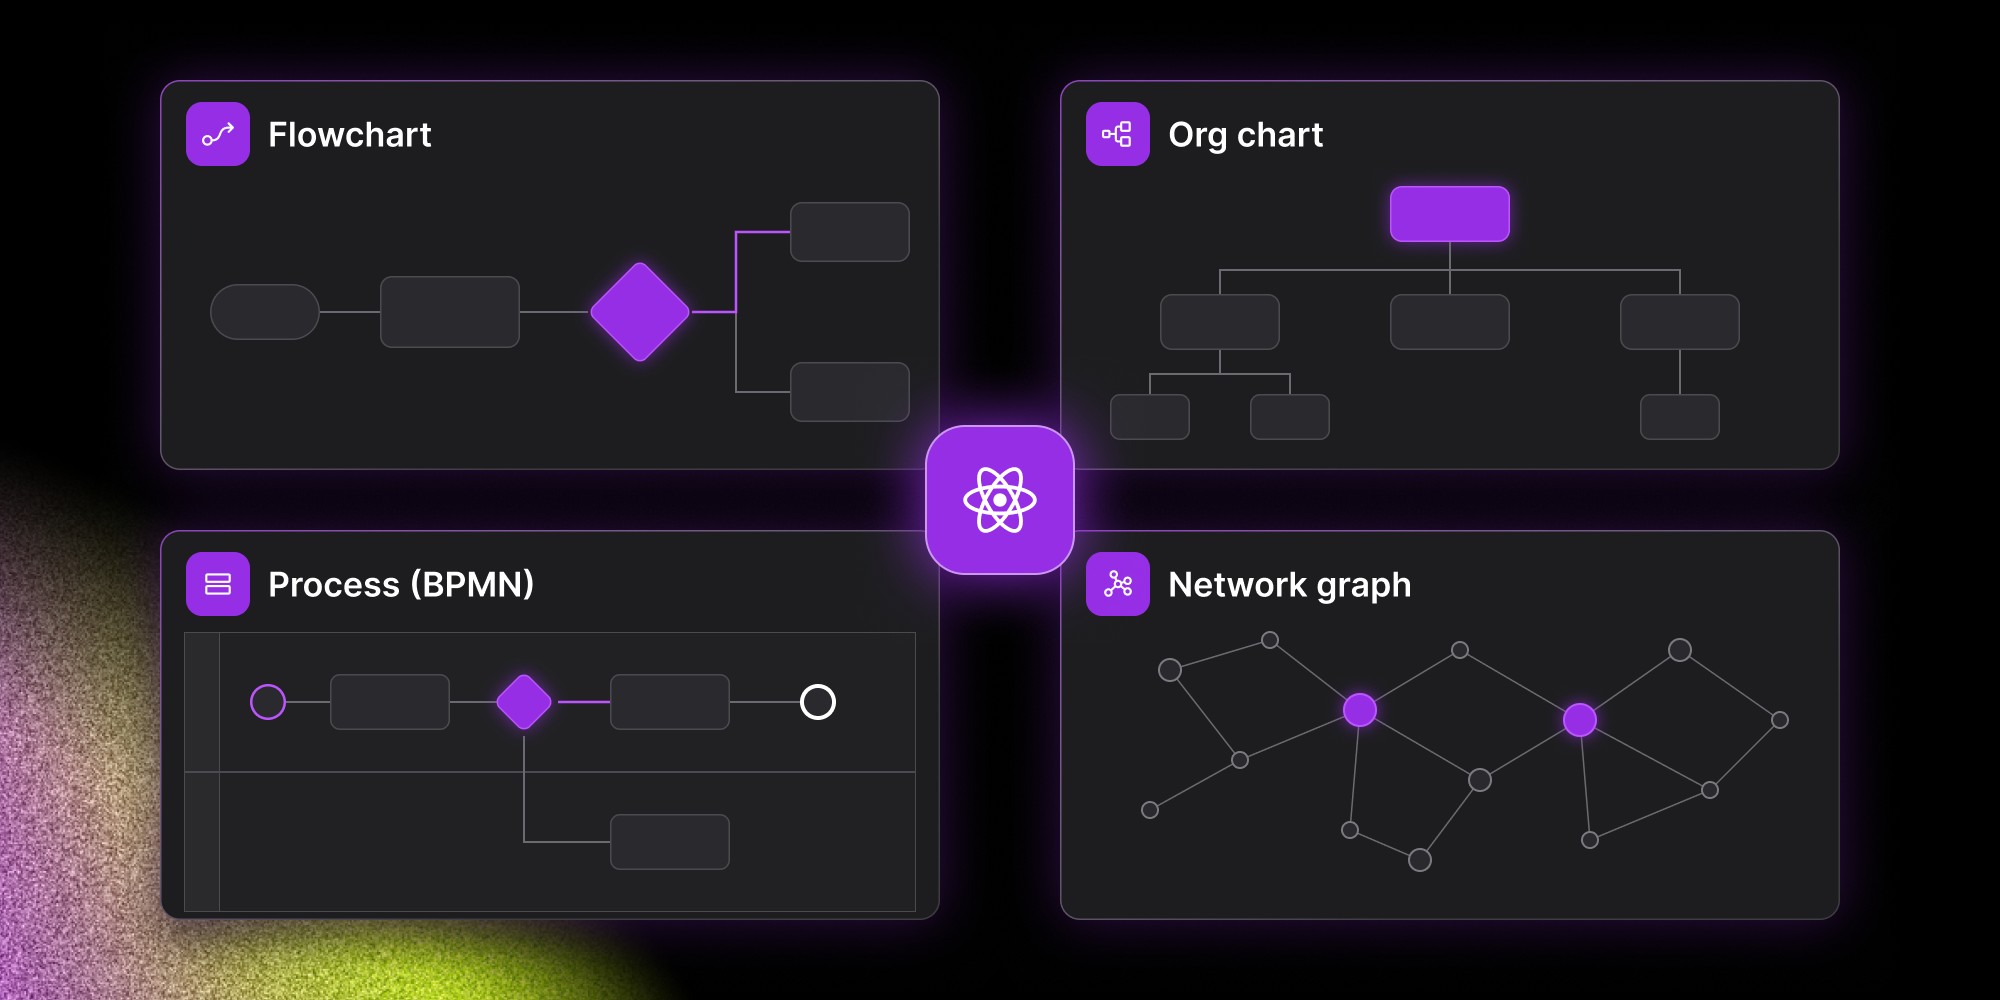
The best React diagram library depends on what you're building. React Flow fits React-first workflow editors. JointJS, GoJS, and yFiles suit enterprise diagram editors, Cytoscape.js handles network graphs, Rete.js executable node graphs, and bpmn-js BPMN modeling. In a Synergy Codes benchmark, React Flow rendered faster than JointJS but needed increasingly aggressive optimization beyond roughly 2,000 to 3,000 nodes.
What are you actually building: a workflow editor, a network graph, a BPMN modeler, or a fully interactive diagramming product?
That question matters more than picking the library with the longest feature list.
React diagramming libraries can look surprisingly similar in screenshots. Most can render nodes and connections. Many support dragging, zooming, selection, and custom styling. The differences become clearer once the application has to support real editing, domain-specific behavior, larger diagrams, collaboration, or a UI that needs to feel native to the rest of the product.
For complex React applications, the strongest options include React Flow, JointJS, GoJS, Cytoscape.js, yFiles, Rete.js, and bpmn-js. They don't all solve the same problem, though, so the useful comparison starts with product fit rather than a universal ranking.
What should a React diagramming library actually provide?
A diagramming library gives developers a foundation for rendering and interacting with visual structures inside an application.
At minimum, that normally means nodes or other graphical objects, connections, viewport controls, and some form of interaction handling. More mature libraries may add layout systems, selection tools, grouping, editing primitives, export support, or their own data model.
How much should come from the library depends on what you're building.
A workflow editor with rich React components inside every node has different requirements from a network explorer displaying thousands of relationships. A BPMN tool has another set of constraints because the notation itself carries rules the software needs to understand.
Synergy Codes works across several of these categories, including React Flow applications, GoJS-based diagram tools, and custom JavaScript diagramming systems. The biggest differences usually show up after the first prototype, when teams start adding the behavior their actual product needs.
Quick comparison: which library fits which kind of application?
A library can appear in several categories. React Flow, for example, can certainly render graph data, while Cytoscape.js can be made interactive. The question is how much work sits between the library's natural model and the product you're trying to ship.
React Flow: a natural fit for React-first visual editors
React Flow is one of the easiest libraries to consider when the surrounding application is already built in React. Nodes can be regular React components, which makes it convenient to embed forms, buttons, status indicators, charts, or other product UI directly inside the diagram. State and interactions can also stay close to the patterns the rest of the frontend team already uses.
Synergy Codes has used React Flow for workflow builders, low-code interfaces, and other products where the canvas needs to feel like part of the application rather than an isolated visualization. Our React Flow guide covers the library itself in more detail.
React Flow's flexibility also means teams have to make more architectural decisions themselves. Layout, advanced edge routing, history, collaboration, and large-diagram optimization often require additional work around the core library.
For complex applications, that isn't necessarily a weakness. It simply means React Flow behaves more like a flexible React foundation than a complete diagramming product.
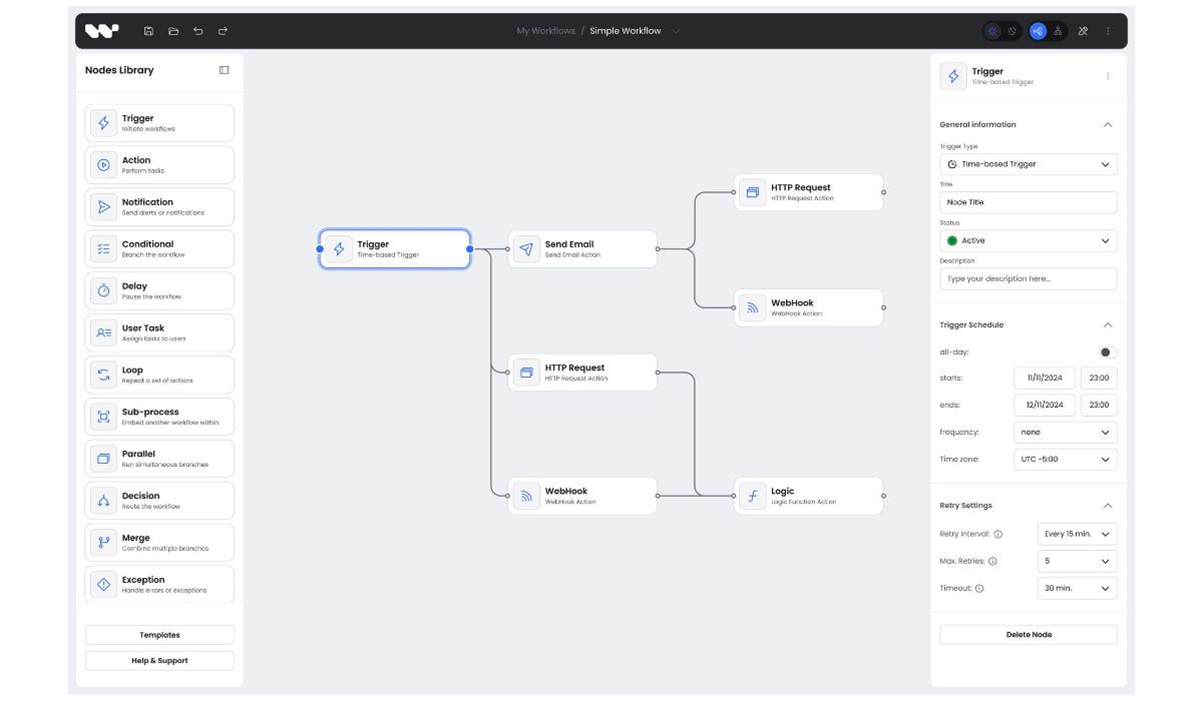
See how Plura AI got a custom React Flow workflow builder
Read case study
JointJS: more diagramming infrastructure outside React
JointJS takes a different architectural route.
Its diagram model and rendering engine exist independently from React. The current JointJS for React integration provides React components and hooks, but the core still uses its own model and SVG-based rendering system. JointJS describes the React integration as intended for production diagramming applications with richer data models and more demanding interaction requirements.
That distinction becomes noticeable when the application grows.
Synergy Codes tested React Flow and the JointJS React wrapper side by side. React Flow produced faster initial rendering in the test, while JointJS kept interaction frame rates more stable as node counts increased. In that benchmark, React Flow required increasingly aggressive optimization beyond roughly 2,000 to 3,000 nodes, while JointJS remained smoother in the larger interactive graphs tested.
Those results shouldn't be treated as a universal benchmark for every application. Node complexity, rendering choices, browser conditions, and application state architecture all matter. They do illustrate why rendering architecture becomes part of the library decision once the graph stops being small.
For the complete test setup and results, see the React Flow vs JointJS React wrapper comparison.
GoJS: a mature option for feature-heavy diagram editors
GoJS has been used for interactive browser diagrams for years and comes with a substantial set of diagramming capabilities.
Its own templating and diagram model give teams access to layouts, grouping, linking behavior, commands, selection logic, and other editor functionality without assembling every feature from separate frontend components.
The trade-off is that developers work within the GoJS model rather than using React as the representation for everything on the canvas. For products where the diagram itself is a sophisticated application, that can be useful. Teams building technical editors, infrastructure tools, engineering diagrams, or other heavily interactive canvases may value the amount of behavior already present.
React teams should still prototype the kinds of nodes they expect to build. A highly custom node with a lot of existing React UI can feel very different to implement in GoJS than the same node would in React Flow.
Synergy Codes maintains a dedicated GoJS development resource for teams already working in that ecosystem.
Cytoscape.js: better aligned with graphs than workflow forms
Cytoscape.js makes more sense when the application is fundamentally about relationships in a graph.
Knowledge graphs, biological networks, dependency maps, and other graph-heavy visualizations often need graph algorithms and layout behavior more than they need form controls embedded in every node.
Cytoscape.js has a strong graph-oriented model and an ecosystem of layouts and extensions. Developers can create interactive applications with it, but the starting assumptions differ from a library designed around React component nodes.
If most of the product requirements sound like "explore, filter, analyze, highlight, traverse," Cytoscape.js deserves consideration. If they sound more like "configure, connect, edit, validate, submit," a workflow-oriented diagramming library may create less friction.
yFiles: broad functionality for enterprise visualization
yFiles is a commercial diagramming SDK with extensive support for graph visualization, automatic layout, interaction, and large application requirements.
It tends to enter the conversation when teams want more functionality available from the library itself and are comfortable buying a commercial toolkit rather than assembling the editor from open-source primitives. Complex hierarchy visualization, network diagrams, and applications with demanding automatic layout requirements are typical use cases.
Procurement is part of the decision here, not an afterthought. A technically strong fit still needs to make sense in the product's licensing model and long-term cost structure.
Rete.js: when the graph represents executable logic
Rete.js is more specialized. It's designed around visual programming and node-based processing, making it relevant when the graph isn't only a representation of information but also models executable logic.
That can work well for visual programming environments, processing pipelines, and products where inputs and outputs move through typed nodes. Teams building a general-purpose diagram editor may find that specialization unnecessary. Products with executable node graphs may find it closer to their domain than a more neutral diagramming library.
bpmn-js: when BPMN is the product requirement
Sometimes the library decision becomes much easier because the notation is already defined.
If users need to create or edit BPMN processes, bpmn-js deserves consideration because it was built specifically around BPMN modeling rather than generic nodes and edges. Using a general graph library to recreate the BPMN editing experience means implementing rules that a BPMN-focused toolkit already understands.
The opposite is also true. If you're building a custom workflow product that doesn't need BPMN, adopting a BPMN model simply because the library is mature may impose concepts your users never asked for.
7 questions to ask before choosing a React diagramming library
Feature tables are useful, but they rarely expose the decision that causes trouble six months later.
Before committing to a library, I'd ask these seven questions.
1. What does a node need to contain?
Start with your hardest node rather than the simplest one in the prototype.
Does it only need an icon and label? Or does it contain forms, charts, live status, menus, validation messages, or custom controls from your existing React design system?
If nodes are effectively mini React applications, React-native rendering becomes much more valuable. But if the objects are primarily graphical shapes with structured metadata, an independent diagramming engine may be easier to manage.
2. How large will the real diagram become?
Ask for the largest realistic production case, not the average demo.
A product that normally displays 40 nodes and occasionally reaches 150 has different requirements from one expected to manipulate several thousand elements interactively.
Performance also depends on what's inside each node. 10,000 lightweight SVG objects aren't equivalent to 10,000 complex React components.
Our own React Flow vs JointJS benchmark is useful precisely because it separates initial rendering from interaction performance instead of reducing scale to one number.
3. Is the diagram mainly viewed or heavily edited?
Viewing and editing put different pressure on a library. A network visualization may prioritize layout, navigation, search, and filtering. A workflow editor needs stronger support for connection creation, selection, node configuration, validation, and editing history. Many libraries can technically do both. Development effort can still be very different.
4. How much layout intelligence do you need?
Manual placement is fine for some products. Others need hierarchical layouts, orthogonal routing, automatic arrangement, or continual recalculation as the graph changes.
React Flow can integrate external layout engines, but it doesn't attempt to solve every layout problem internally. Synergy Codes notes the same distinction in its existing React Flow guide. Products where layout is a core capability should evaluate this before committing to the rendering layer.
5. Will several users edit the same diagram?
Real-time collaboration affects the architecture far beyond showing another user's cursor. Teams need to synchronize changes to nodes and edges without corrupting the document. Simultaneous edits can touch layout, configuration, or relationships in different parts of the graph.
Synergy Codes uses Yjs for collaborative diagram applications and has integrations for React Flow and GoJS. The Yjs diagram collaboration work covers some of the challenges around synchronizing complex diagram state. A product expected to become collaborative later should leave room for this in its state architecture from the beginning.
6. What accessibility requirements will the product have?
Diagram accessibility is easy to defer because early prototypes tend to be mouse-driven.
Production products may need keyboard navigation, focus handling, screen-reader semantics, or compliance with broader accessibility requirements.
React Flow provides keyboard and ARIA functionality that can be extended by the application. JointJS exposes a different interaction model, so accessibility implementation needs to be evaluated in context. Synergy Codes' React Flow vs JointJS comparison covers the differences in more detail. Don't wait until the diagram contains several years of interaction logic before asking how someone operates it without a mouse.
7. How much of the editor do you actually want to build?
Some teams want maximum control over the canvas and are comfortable building the surrounding product functionality themselves.
Others want to start with more diagram features already available. Neither choice is automatically cheaper. A lighter library may have no license fee but require more engineering around it. A commercial SDK may reduce implementation work while creating a recurring licensing cost.
Compare the total product work required to reach the experience users need.
Compare React Flow and GoJS with a free decision checklist
Get the checklist Classify the product before comparing libraries
Instead of starting with seven browser tabs containing library homepages, classify the application first.
You're building a workflow or low-code editor
Start by looking closely at React Flow, especially when the product is already React-based and custom node UI matters.
Rete.js may become interesting if execution and visual programming are central to the product.
You're building an enterprise diagram editor
JointJS, GoJS, and yFiles deserve closer evaluation because their built-in diagramming models and mature tooling can reduce how much editor infrastructure the team has to create itself.
You're visualizing networks or relationships
Start with Cytoscape.js, then compare it with larger graph-visualization platforms depending on scale and interaction requirements.
You're modeling BPMN
Start with bpmn-js rather than recreating BPMN behavior using a general diagramming toolkit.
A classification like this is more useful than asking for the single "best React diagramming library" because the libraries aren't trying to occupy exactly the same category.
Rendering architecture matters most in complex diagrams
Small demos hide architectural differences. Once a diagram grows, rendering technology affects interaction speed, customization, and how much optimization the application needs.
React Flow keeps node rendering inside the React ecosystem. That makes custom React components easy to use but means frontend architecture has a direct impact on diagram performance.
JointJS uses its own SVG rendering engine. GoJS also controls more of its drawing pipeline independently from React. Graph-focused libraries can make other trade-offs depending on whether they use Canvas, SVG, WebGL, or combinations of them.
No rendering technology automatically wins at every scale. The right test is your own graph with your own node complexity and interaction pattern.
React integration is more than "works with React"
Almost every JavaScript library can technically be integrated into a React application, but that doesn't mean the development experience is the same.
A React-native library lets teams use familiar component composition and state patterns directly inside the diagram. Framework-independent libraries usually introduce another model that React needs to communicate with.
For a relatively isolated visualization, the distinction may not matter much. It becomes more noticeable when the diagram shares forms, menus, state, and UI components with the rest of a large product. JointJS has improved this experience with its official React integration, which now exposes components and hooks rather than requiring teams to invent their own wrapper layer.
Even so, teams should test how the integration feels with their own application architecture rather than stopping at the existence of a React package.
Don't choose on the demo alone
Diagram library demos are designed to show each tool at its best. A product evaluation should do almost the opposite.
Build the awkward node. Load a graph larger than the current customer average. Try the interaction that happens hundreds of times per day. Add the side panel that has to synchronize with canvas selection. Then, measure what needed custom code. The same principle applies to commercial libraries. A huge built-in feature set only creates value when those features match the editor you're building.
Synergy Codes offers a code and architecture audit for node-based applications for teams that already have a diagram product and need to understand where its current architecture is likely to hit scaling limits.
So, which React diagramming library should you choose?
For React-heavy workflow editors, React Flow is usually one of the first libraries worth prototyping because custom nodes and the surrounding UI can stay within familiar React patterns.
Applications that need a stronger independent diagram model or consistently complex interactions should also test JointJS. GoJS and yFiles become relevant when the team is comfortable with commercial tooling and wants more diagram functionality available from the platform itself.
Cytoscape.js fits a different problem particularly well: relationship-heavy graph visualization. Rete.js becomes more interesting when the nodes represent executable processing logic, while bpmn-js makes sense when BPMN is non-negotiable.
Choosing among them gets much easier once the product team stops comparing logos and starts comparing the work the application will ask users to do.
Synergy Codes has built diagramming products with several of these stacks, so teams that are still evaluating technology can start from the wider JavaScript diagram development work or explore our dedicated React Flow services.
- Which React diagram library is best for complex applications?
No single React diagram library wins every case, because the libraries solve different problems. React Flow is usually the first to prototype for React-heavy workflow editors, JointJS suits applications that need a stronger independent diagram model, and GoJS and yFiles fit teams comfortable with commercial tooling. Cytoscape.js fits relationship-heavy graph visualization, Rete.js fits executable node logic, and bpmn-js fits products where BPMN is required.
- What are the main React Flow alternatives for complex React applications?
The main React Flow alternatives are JointJS, GoJS, yFiles, Cytoscape.js, Rete.js, and bpmn-js. JointJS and GoJS control their own diagram model and rendering independently from React, and GoJS gives teams layouts, grouping, and editor commands without assembling every feature from separate components. Cytoscape.js, Rete.js, and bpmn-js are more specialized: graph analysis, executable node graphs, and BPMN modeling.
- How does React Flow compare with JointJS on performance?
In a Synergy Codes benchmark, React Flow produced faster initial rendering, while JointJS kept interaction frame rates more stable as node counts increased. React Flow needed increasingly aggressive optimization beyond roughly 2,000 to 3,000 nodes. Results depend on node complexity, rendering choices, and state architecture, so test each library with your own production-sized graph.
- When does a commercial diagramming library like GoJS or yFiles make sense?
A commercial diagramming library makes sense when your team wants more diagram functionality available from the library itself and accepts a recurring license cost. GoJS also brings its own programming model, so React teams should prototype their most complex node first. An open-source library may have no license fee but require more engineering around it, so compare the total product work.
- What should you check before choosing a JavaScript diagram library?
Check what your most complex node must contain, how large the real production diagram will get, and whether users mainly view or edit it. Then check layout needs, real-time collaboration, accessibility requirements, and how much of the editor your team wants to build. Prototype the hardest node on a production-sized graph instead of relying on vendor demos.
- Can Synergy Codes help choose or build a React diagramming solution?
Yes. Synergy Codes has built diagramming products with several of these libraries, including React Flow and GoJS, and uses Yjs for collaborative diagram applications. Teams with an existing diagram product can start with a code and architecture audit for node-based applications, which shows where the current architecture is likely to hit scaling limits.
Content Marketing Specialist who's spent the last decade making tech topics actually readable. With an MA in Brand Communication, Ida has crafted content strategies for several IT companies. Her portfolio spans from Kubernetes tutorials to enterprise software guides, now focusing on data visualization and diagramming solutions.

Find how we can help you enhance your software and win more deals
Contact us to discuss your project. After you submit the form, we’ll get in touch with you within 48 hours to arrange a call.