Custom wire harness design software: from Excel to editor

How we turned an Excel from-to list into browser-based wire harness design software in about 2 weeks, and why the domain took more work than the diagram.
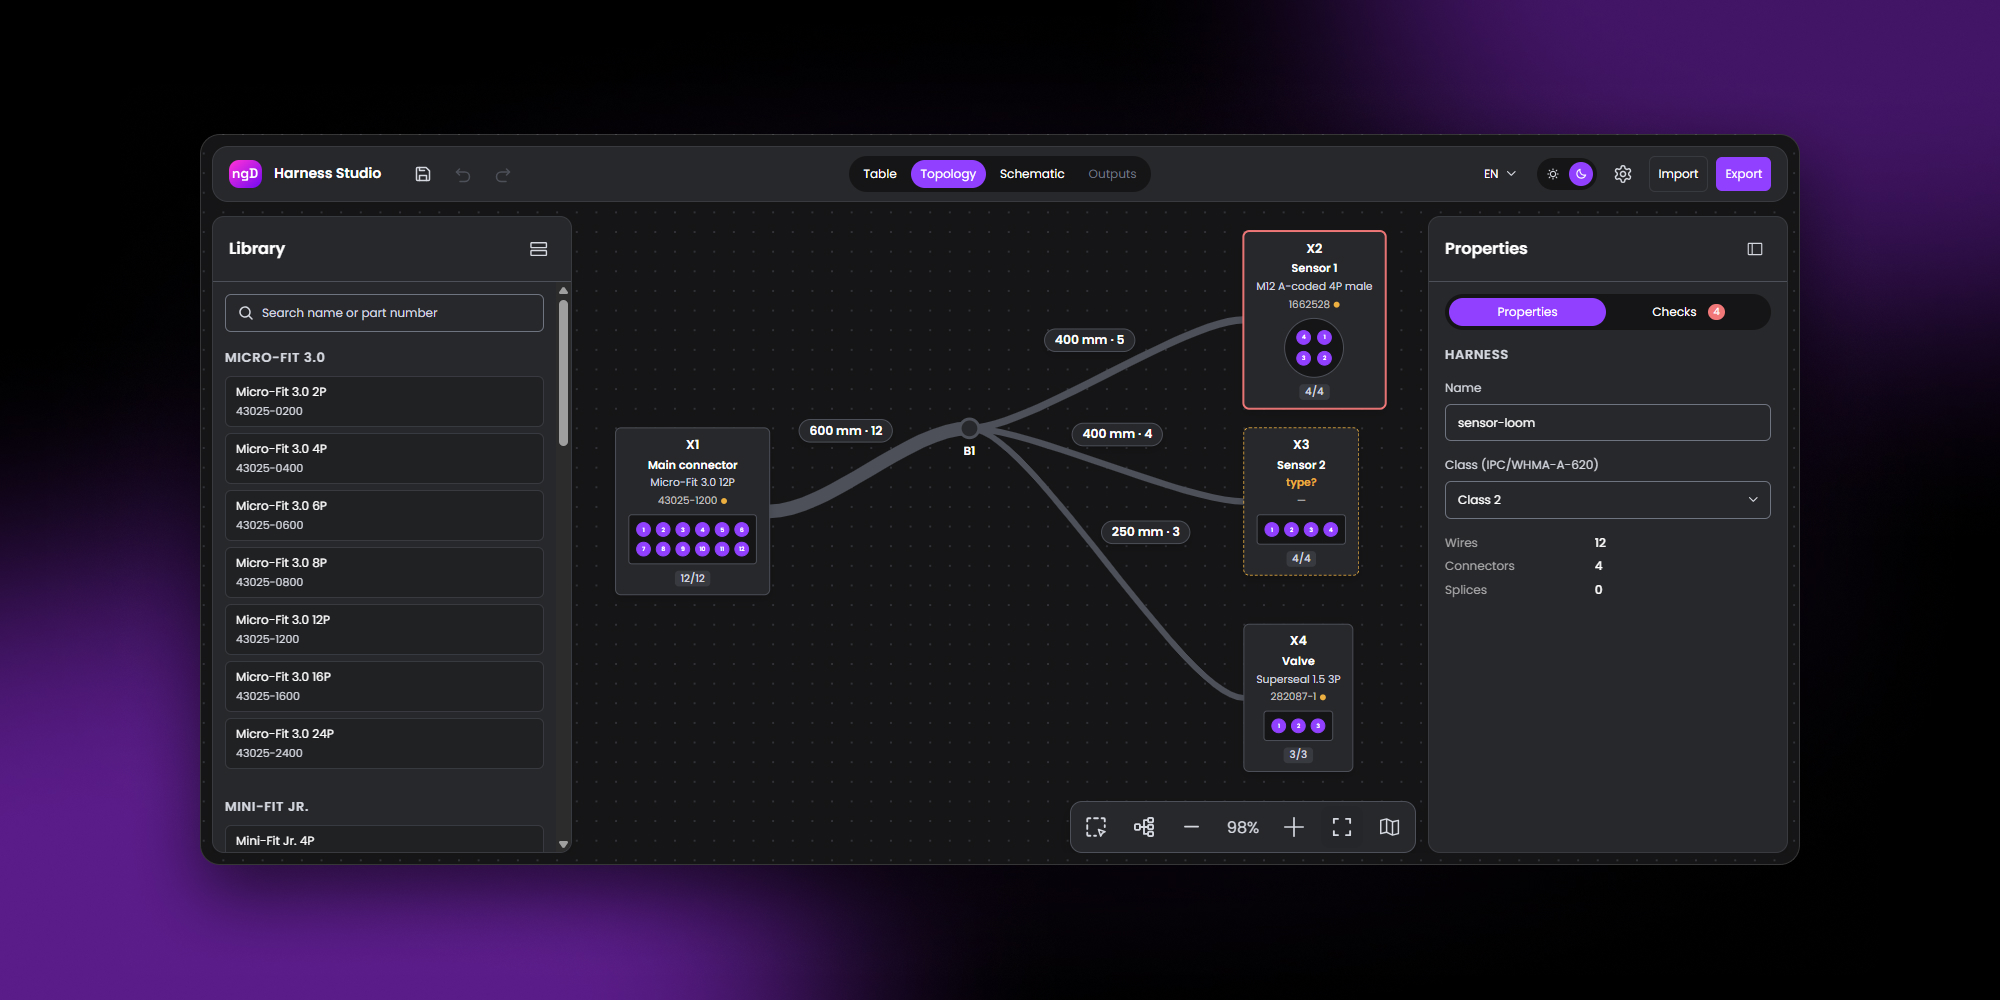
Harness Studio is wire harness design software we built in about 2 weeks: from-to list import from Excel, a topology canvas, 12 rule checks, and the files a harness shop builds from (wire list, cut list, BOM, labels, DXF, WireViz). The diagram layer came from ngDiagram templates and agent skills. The real work was understanding how a harness gets built and shaping the workflow around it.
In the 2025 Wiring Harness Manufacturer's Association (WHMA) industry survey, 47.6% of wire harness makers still run their design process on Excel or Word. We spent about 2 weeks turning that Excel list into browser-based wire harness design software, Harness Studio, built on the open-source ngDiagram library and its agent skills. Almost none of the work was diagram code.
Understanding the problem first: what a harness shop actually needs
A wire harness is a set of wires cut to length, crimped with terminals, pushed into connector cavities, and taped into branches. The document that describes it is the from-to list (some tools call it a to-from list): one row per wire with the connector and cavity at each end, cross-section, color, length, and a remark. The wire harness drawing is a picture of that list.
This was my first harness tool, so the work started with how a harness shop works, not with the canvas. What harness makers say about their work today shaped the scope:
- In the 2025 WHMA industry survey, 47.6% of harness makers still rely on Excel or Word-based tools, and nearly 74% call their quoting process "manual, time-intensive, and too slow" (IPC/WHMA, September 2025).
- In the same survey, 76% report customer design errors "sometimes" or "often", and 50% struggle with incomplete or inaccurate customer information.
- A harness shop engineer on customer drawings: "If you can produce a complete cut sheet from the drawing without guessing, then it's probably good enough" (Wiring Harness News).
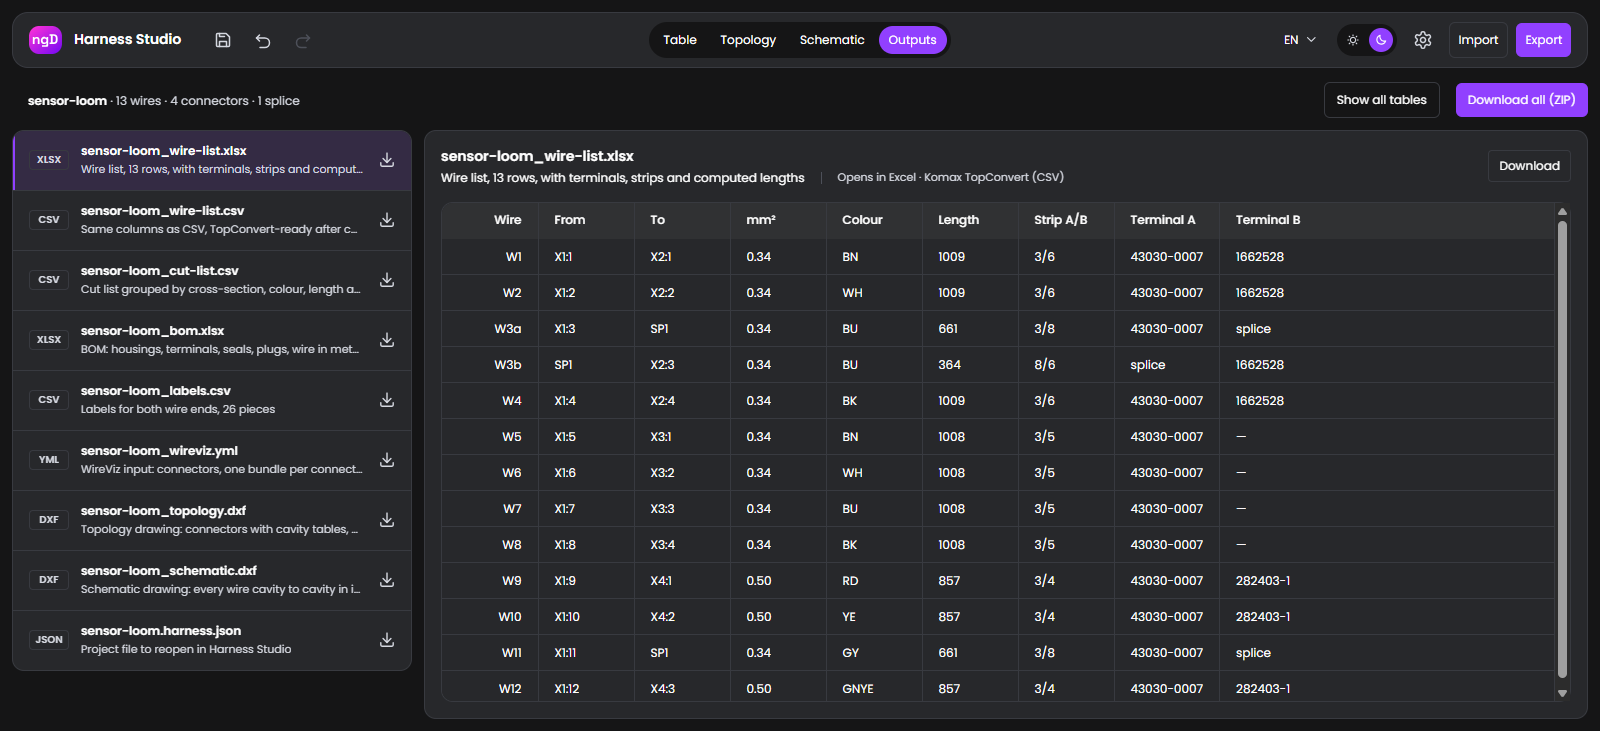
That last quote set the bar. What a shop needs from the tool is a few files that agree with each other:
| File | What the shop checks first |
|---|---|
| Wire list | Lengths include strip allowance and follow the right branches, both cavities filled, terminal part numbers present |
| Cut list | Same cross-section, color, and length grouped with a quantity, metric units |
| BOM (bill of materials) | Housings, terminals, and seals, not only housings; wire per meter; labels as pieces |
| Labels | Wire ID on both ends, printable count |
| Harness drawing (DXF) | Segment lengths equal the ones on screen, connector tables complete |
2 facts drove the whole data model. A wire's cut length is the sum of the bundle segments it runs through plus a strip allowance at each end, so the harness topology (connectors, breakouts, and segments with lengths in mm) has to exist as data the tool can add up. And a splice sits on a bundle at the point where one wire becomes two, which changes wire IDs, lengths, and the BOM.
Once that was clear, the editor was mostly bookkeeping around those 2 facts.
The approach: understand the workflow, then automate it
The method was the one we use for any custom engineering workflow software at Synergy Codes: understand the workflow, pick the smallest slice that proves it, mock it, plan it in stages, then build. The build is the last and shortest step.
- Research the industry before the library. Who draws harnesses, with what, where the process breaks, and which files the shop needs at the end. Vendor claims and user complaints were kept apart.
- Pick the slice. A harness workflow has more pieces than one tool should start with: cable assembly configuration, a multi-branch editor, a 1:1 formboard, table import. We chose the editor plus the import: paste the Excel you already have, get the harness drawn, checked, and exported. The formboard was left out on purpose.
- Mock it before building. A static clickable HTML mockup fixed the screens and the core flow before any code: import a table, fix what the checks flag, download the files. Arguing over a mockup is cheaper than arguing over a build.
- Plan in stages with a human check each. The plan has about 20 stages, each ending with a verify step a person can run in 5 minutes: "computed length 600 + 400 + 2 × 5 = 1010", "the German-language sample import shows 1 error and 3 warnings". Dependencies are explicit, and dropping a stage must not break the earlier ones.
- Build with agents, one stage per agent. Each agent gets the stage text, the domain notes, the mockup, and the ngDiagram skills to load, and a person runs the verify step at the end. A stage that fails its check twice goes back to planning instead of being patched by the next one.
The approach is similar for any engineering diagram we automate, from P&ID diagrams to AV schematics: the domain model comes first, and the diagram is a projection of it. Wire harness automation was a new domain for us. The method was not.
Get electrical design software built around your standards and workflow
Check our offer
Implementation with ngDiagram templates and skills: how little of it was diagram code
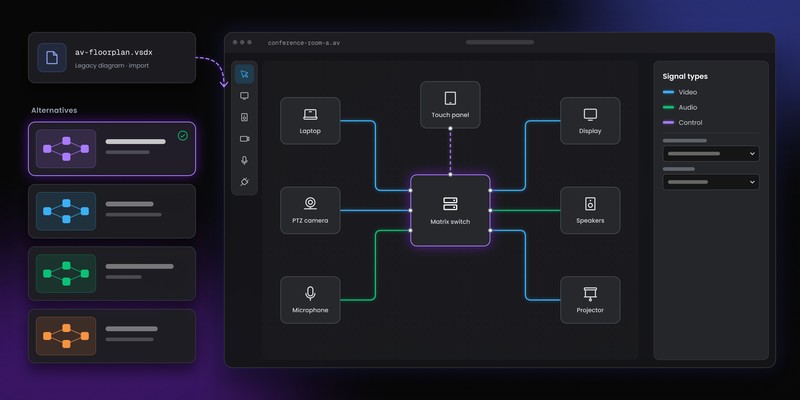
The diagram layer took the least time of the whole project. Harness Studio runs on Angular 21 and ngDiagram 1.4, the open-source Angular diagramming library we build at Synergy Codes (Apache 2.0, no external dependencies). Most of it was copied from the open-source ngDiagram templates, chiefly the electrical and AV ones, rather than written:
- AV schematic template: port-to-port linking, wire edges labeled at both ends, jump to the other end of a wire
- Single-line diagram (SLD) template: the junction model, where a wire dropped onto a wire splits it, became the model for breakouts and splices on a bundle
- Rack elevations template: the app shell (sidebars, navbar, library panel, minimap) and the DXF writer shared by all the templates
- Org chart template: the Eclipse Layout Kernel (ELK) auto-layout recipe
ngDiagram ships 31 agent skills: fundamentals, setup, custom nodes, custom edges, ports, linking, palette, middleware, persistence, shortcuts, transactions, auto layout, troubleshooting, and more. One command installs them into the repo. Every stage brief named the skills to load, and every agent started from the fundamentals skill. A docs Model Context Protocol (MCP) server answered version-matched API questions, so nobody guessed at method names.
The diagram code that mattered is small: node templates for connectors and breakouts, an edge template for bundle segments with an inline length editor, a connection rule that refuses a cavity port as a segment end, and a model adapter that routes ngDiagram's undo to our store. Everything else on the canvas is the library's default behavior.
The architecture decision that made this cheap: the domain model is a plain TypeScript signal store, and the ngDiagram model is a projection of it. Nodes are connectors and breakouts; edges are bundle segments. Wires are not diagram elements at all. A middleware intercepts a cavity-to-cavity drag and turns it into an add-wire command; the temporary edge never reaches the diagram. Reports read the store, never the canvas. Every user action is a command that returns its inverse, which made undo and redo a thin layer over the store instead of a feature of its own.
The rest of the time went into the parts no library ships: the domain, the UX, and the decisions below.
UX decisions: where most of my time went
Most of my own hours went into the workflow: which screen the user is on, what is one click away, and what the tool refuses to do. The agents built what the plan said. Deciding what the plan should say was the work.
One editor, no wizard. The first version had a 3-step stepper: import, edit, outputs. It was built, tested, and removed the next day. A harness engineer does not move through steps. They jump between the list and the picture. Now there is one route and a view toggle, Table | Topology | Schematic | Outputs, all over the same store. Edit a cavity in the table, and the topology cavity fills in. Draw a wire on the canvas, and the table row appears.
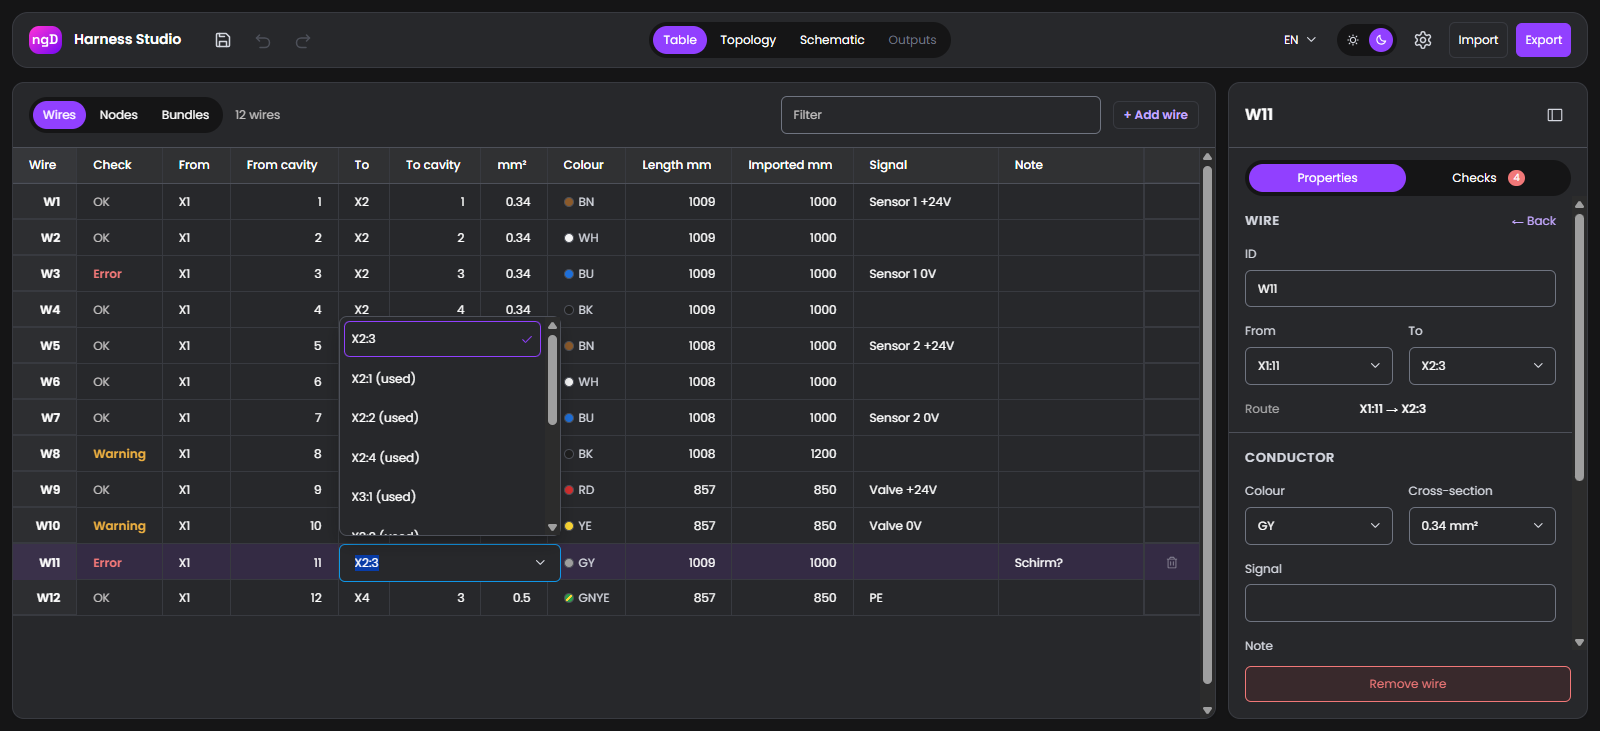
The table is a first-class view. Harness people live in Excel, so the wire list is an editable grid with sorting, filtering, inline comboboxes for endpoints, and keyboard navigation. An imported table lands there first. The Nodes and Bundles tables sit next to it, so bundle lengths can be typed in a column instead of clicked one by one.
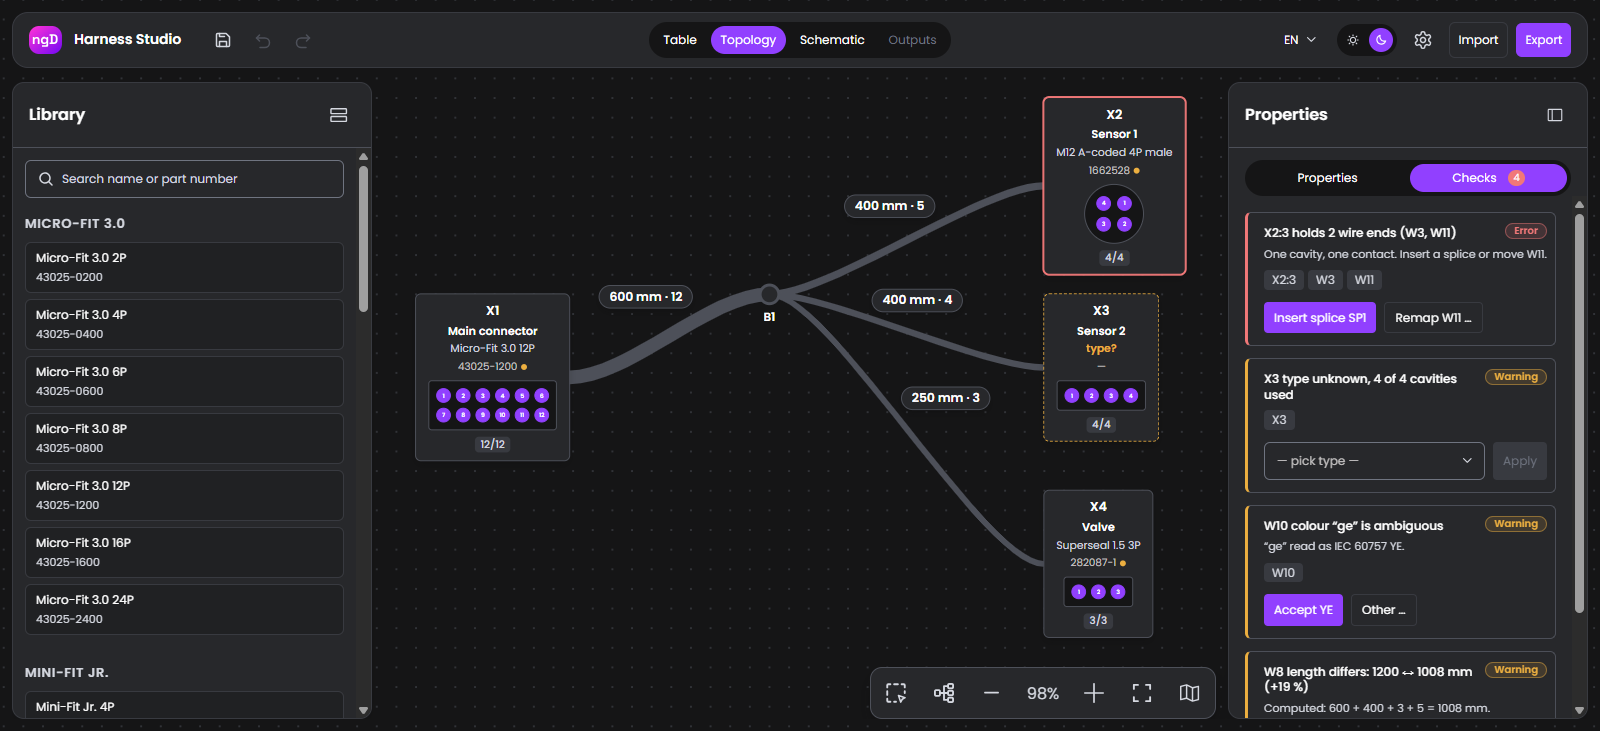
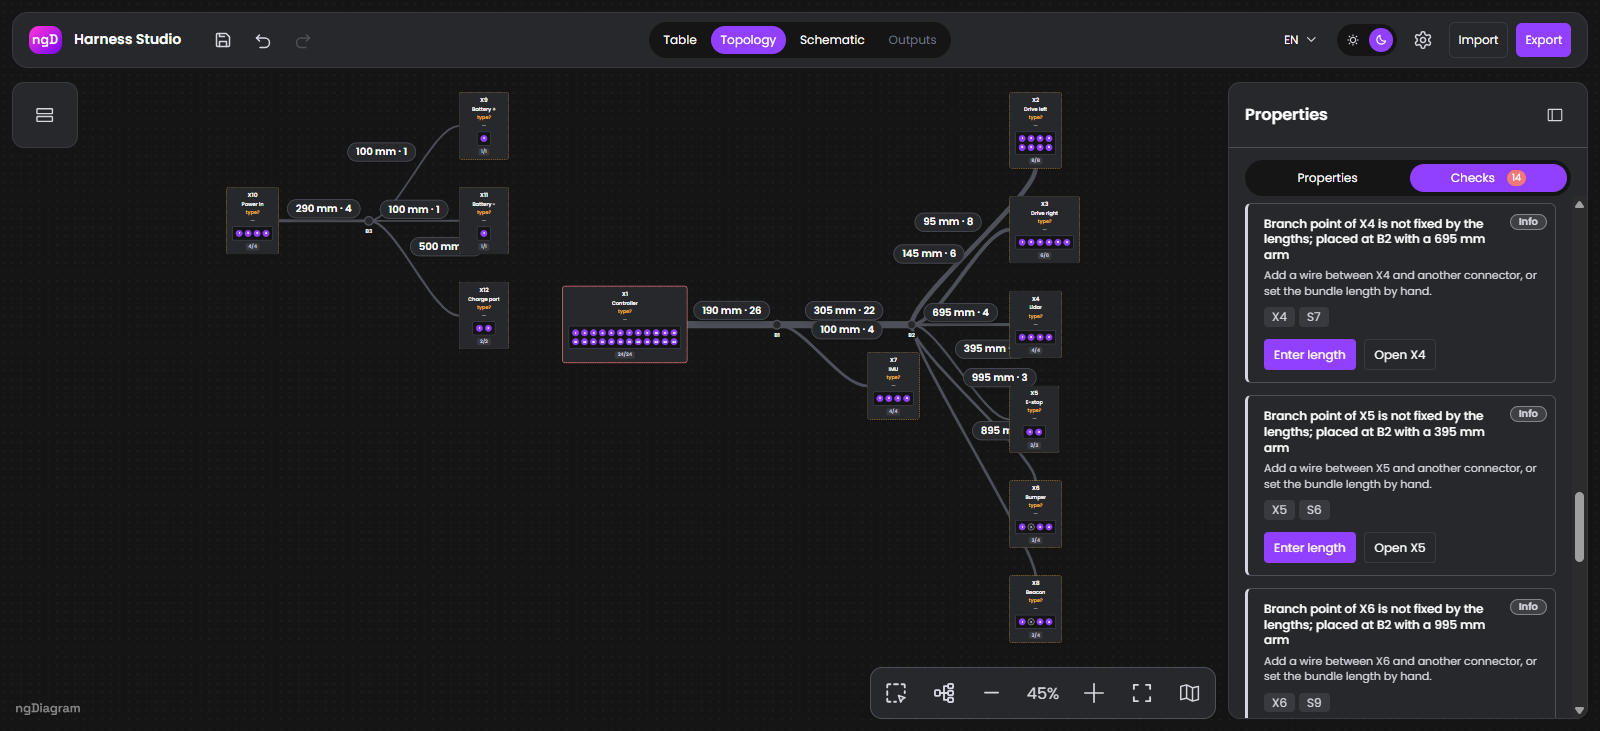
Wires are not drawn on the topology. The topology view shows connectors, breakouts, and bundle segments with their lengths. Wires live inside the bundles. Drawing 30 wires as edges would turn the canvas into a hairball. Instead, a cavity table in the properties sidebar maps cavity to cavity, and a click on a cavity highlights its whole net across both canvases, with a chip showing wire ID, color, cross-section, and computed length.

Checks lock the outputs. 12 rule checks run on every change: duplicate cavity, cavity overflow, missing segment length, no route, unknown connector type, unmapped color, length mismatch above 5%, gauge outside the terminal range, missing seal, unused splice, ring topology, and assumed branch point. While any error is open, the Outputs view is locked. Each issue carries a fix action: insert a splice, pick a type, enter a length, accept a color. The moment that sells the checks is one click on "Insert splice" turning a red error into a green generate button.
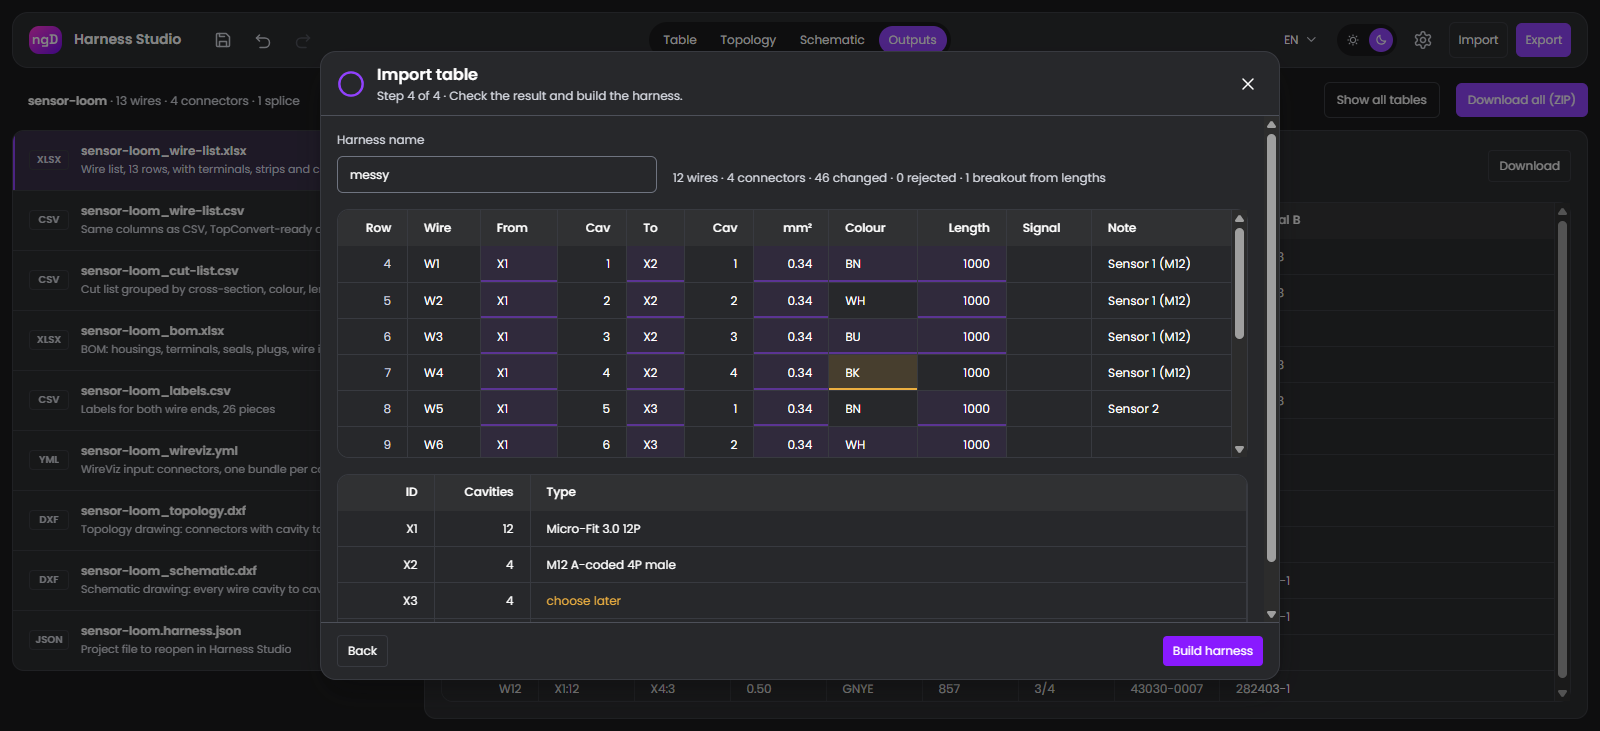
Import is 4 steps and shows its work. Source, rows, columns, preview. The preview marks every cell the importer changed, with the original on hover, and lists rejected rows in red. The same records go into an import report XLSX, so a shop can audit what the tool guessed.
Score your electrical documentation in 10 minutes with 25 questions
Get the checklistEdge cases and the decisions behind them
Most of the hard decisions had nothing to do with drawing. They came from the data a harness carries.
Where a splice lives. The first version treated a splice like a small connector: a node on the canvas with its own ports. It looked right and behaved wrong. A splice does not start a branch. It sits somewhere along a bundle, and its position decides the length of every wire that ends in it. The rework put splices on the bundle segment itself, at an offset in mm, and wire lengths follow from that. Inserting a splice on a doubled cavity also splits the wire into 2 IDs (W3 becomes W3a and W3b) and keeps the original ID in the note, because the shop will look for it.
Drawing a harness from a table that has no drawing. An imported Excel table has wire lengths but no picture. Those lengths are enough to recover most of the layout: each wire's cut length minus its strip allowances is a route through the harness, and 3 connectors wired to each other pin down their shared branch point. Where the lengths do not fix a branch point, the importer places it anyway and says so as an info-level check. We chose not to average out inconsistent rows. A row that disagrees with the rest shows up as a length-mismatch warning, which is what an intake engineer wants to see.
Normalize everything, record everything. Incoming tables mix German and English headers, decimal commas, lengths in m or mm, gauges as mm² or American Wire Gauge (AWG), and colors as codes, names, or German abbreviations ("ge" is yellow). The importer maps all of that, and it keeps a record of every cell it touched: mapped, changed, needs confirmation, or rejected. A guessed color becomes a warning the user has to accept. An unknown connector becomes X5 with the original text kept as its label.
No unit guessing. Millimeters everywhere, integer lengths, cross-section as a number in mm². One question stayed open on purpose: the import takes the length column as cut length and does not ask whether it might be route length. That is a question for the customer's workflow, and guessing it would hide a real error.
A small AI step for the files that are not tables. A from-to list often arrives as a PDF drawing sheet or a photo. For those we added one model call: read the grid of cells exactly as printed, without converting units or renaming anything. The result goes through the same import pipeline as an XLSX, so the mapping, normalization, and import report are identical. The model only replaces the file parser, which keeps its output easy to check.
What I learned about wires, splices, and harness shops
Engineering projects are the best way I know to learn a domain, because the domain pushes back. A harness engineer adds up segment lengths and strip allowances by hand, and one wrong number ends the trust in the tool. 3 things stuck.
Strip length is part of the cut length. Each terminal has its own strip allowance – 3 mm for a Micro-Fit crimp, 8 mm on a splice sleeve – and the wire list has to show it. A list without strip lengths is a list the shop cannot cut from, however good the drawing looks.
The BOM is where customer data fails, and housings are the easy part. A complete BOM lists terminals per wire end, single-wire seals on sealed housings, cavity plugs for the empty cavities of those housings, splice sleeves, wire by the meter per cross-section and color, and labels as pieces. BOM completeness is the top operational challenge for 57% of harness manufacturers, according to a vendor survey cited by Wiring Harness News.
A cut list is an aggregation. Same cross-section, color, length, and strips collapse into one row with a quantity, so 8 identical 1010 mm wires are 1 line. The cutting machine wants metric units and its own column layout, so the file goes through a column mapping on the way out.
None of this comes with a diagramming library, and none of it should. It is why the project spent more time on harnesses than on the canvas.
When custom wire harness design software makes sense
Custom wire harness design software makes sense when the workflow around the harness is yours and the off-the-shelf tool cannot be bent to it. For a harness shop that only needs internal design, the build-vs-buy answer is buy. RapidHarness starts at USD 219 per month per seat, WireViz is free and text-based, and full electrical CAD (ECAD) software like Zuken E3.series, Siemens Capital, or SOLIDWORKS Electrical covers the whole electrical wire harness design process for companies that can afford the seats and the training.
The custom case is different. It is the OEM that wants customers to upload a from-to list on its portal. The harness shop whose intake engineer wants every incoming Excel checked before quoting. The connector maker that wants its own catalog inside the editor. The team whose data has to land in its ERP as a JSON object plus a DXF. None of those are features of a per-seat desktop tool, and all of them are a couple of weeks of work once the domain model is right. We built a custom AV design and proposal tool on the same principle: the diagram is the interface; the workflow is the product.
The off-the-shelf vs custom software decision comes down to one question: do you need the tool to fit your workflow, or your workflow to fit the tool? If the answer is the first, the open-source ngDiagram templates, the agent skills, and a staged plan get you to working wire harness design software in a few weeks. The domain knowledge is the part you bring.
Understanding the workflow is the whole job. Once you know what the shop checks first, you know what to automate. The library and the agents only help you type it faster.
Harness Studio runs in the browser at cable-harness.app.synergy.codes. Open it, import one of the sample tables, and see what the checks say. We are showing Harness Studio at electronica 2026, November 10 to 13.
- How do you design a wire harness?
You start from the from-to list: every wire with its connector and cavity at both ends, cross-section, color, and length. From that list you define the topology (connectors, branch points, and bundle segments with lengths); map cavity to cavity; run checks for duplicate cavities, missing lengths, and gauge versus terminal range; and generate the wire list, cut list, BOM, labels, and drawing. The drawing comes last.
- What is a from-to list in wire harness design?
A from-to list (or to-from list) is a table with one row per wire: the connector and cavity it starts from, the connector and cavity it goes to, cross-section or gauge, color, length, and a remark. It is the primary document a harness shop quotes and builds from, and 47.6% of harness makers keep it in Excel or Word.
- Can wire harness design software import a from-to list from Excel?
Yes. Harness Studio imports XLSX and CSV files, detects the header row, maps English and German column names, normalizes units and color names, and records every change in an import report. When the table has wire lengths, it derives the branch points and bundle lengths from them, so the imported harness lands with its checks already run.
- What outputs should wire harness software generate?
A wire list (XLSX or CSV) with strip lengths and terminal part numbers; a cut list grouped by cross-section, color, and length; a BOM with housings, terminals, seals, plugs, wire per meter, and labels; a labels file; and a harness drawing as DXF. Harness Studio also writes a WireViz YAML file and a project JSON for reloading.
- When does custom wire harness design software make sense instead of off-the-shelf tools?
When the harness workflow is part of a bigger process you own: a customer portal, a quoting intake, your own connector catalog, or an ERP that needs the result as data. If you only need internal design, buy a seat of an existing tool.
- Is a custom harness editor a replacement for ECAD software?
No. A custom editor built on ngDiagram covers the harness workflow you define: list, topology, checks, and outputs. It does not replace schematic capture, 3D routing, or the simulation that ECAD software provides. It sits where ECAD does not: in the browser, inside your own process, with your data.
Delivery Lead and Principal Software Developer at Synergy Codes with 8+ years of experience in diagramming for complex industry-specific projects. Specializes in JavaScript/TypeScript, React, and GoJS to build data visualization solutions and interactive diagramming interfaces. Combines technical expertise with business focus to deliver practical, high-impact applications.

Find how we can help you enhance your software and win more deals
Contact us to discuss your project. After you submit the form, we’ll get in touch with you within 48 hours to arrange a call.