Control logic visualization: making complex electrical systems understandable

Control logic visualization turns static electrical drawings into dynamic systems that show how complex automation actually behaves.
Control logic visualization turns static electrical drawings into dynamic systems that show real behavior, not just structure. By combining visualization with automation and integration, teams reduce errors, improve collaboration, and speed up delivery. Engineers spend less time on manual updates and more on solving real problems – leading to faster, more reliable industrial automation projects.
Engineering teams that design, manage, or scale industrial electrical systems know the problem well. They rely on diagrams, files, and different tools – but none of them show the full picture. When something changes, it becomes harder to track what affects what. Additionally, every change increases complexity.
This article shows how control logic visualization changes that. You will learn how to make complex electrical system design easier to understand, easier to manage, and faster to deliver. You will also see how modern tools replace static diagrams with dynamic, interactive systems that support real decisions.
What control logic visualization means in modern electrical system design?
At its core, control logic visualization is the process of turning system behavior into something you can see, not just describe.
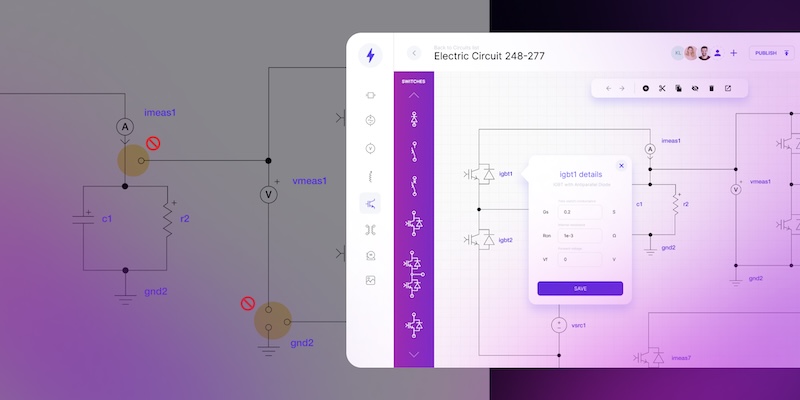
It's a practical umbrella for something engineers deal with daily: turning PLC code, signal dependencies, and system conditions into a visual layer that's fast to read, easy to validate, and straightforward to update. Instead of mentally simulating behavior from documentation, you see it directly.
Replace static electrical drawings with dynamic control logic visualization
Check the offer.png)
Instead of reading logic from PLC code or scattered documentation, you work with a visual layer that shows:
- How signals move across the system,
- How components interact,
- How conditions trigger actions.
This is especially important in industrial automation integration, where systems include:
- Control panels,
- Sensors and actuators,
- SCADA and IoT connections,
- power distribution and grid integration.
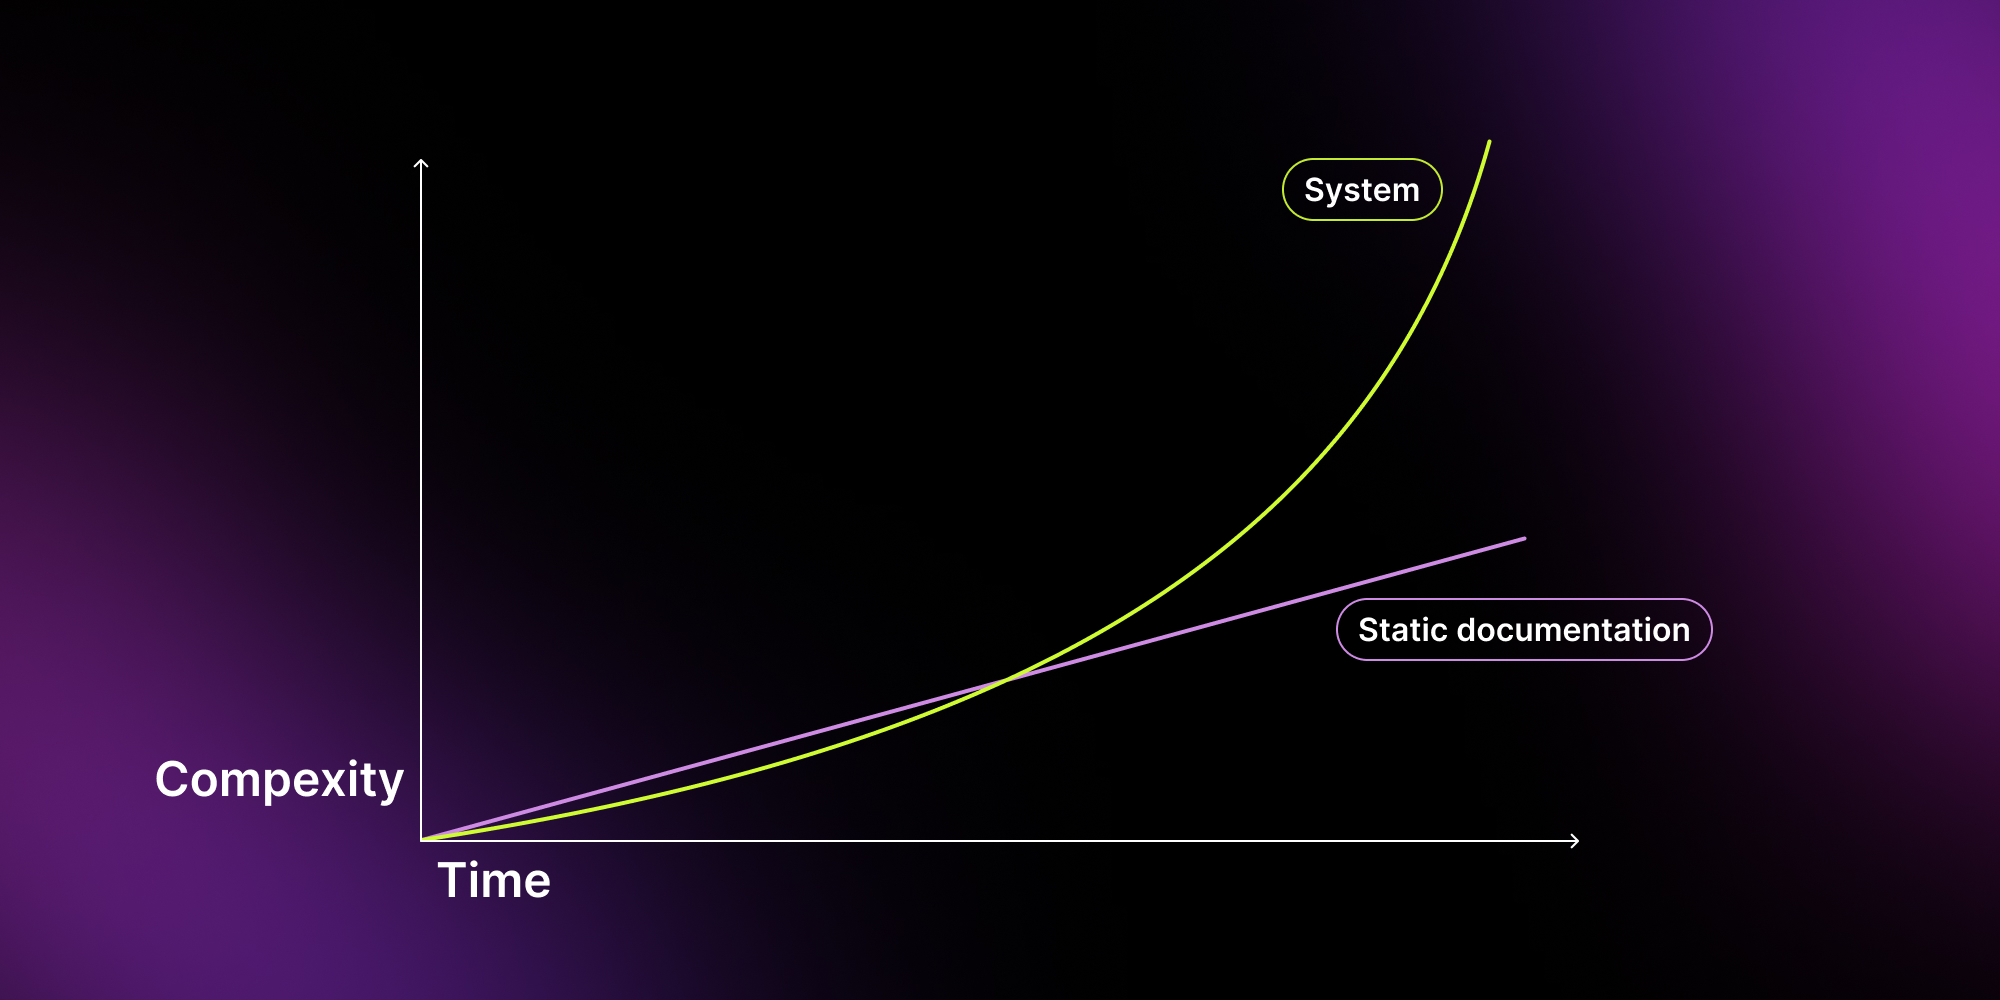
A traditional electrical drawing shows structure. A modern visualization of electrical flow shows behavior. This shift matters because today's systems are no longer static – they often change and scale fast. Without proper electrical system visualization, complexity becomes invisible – until something breaks – and emerging errors are usually costly.
Why visualization of electrical flow is critical in complex systems?
In electrical system design, complexity does not come from size alone. It comes from interactions. A single update in a battery energy storage systems (BESS) setup or a power plant control flow can affect:
- Signal propagation,
- System performance,
- Safety conditions.
If your control logic lives in multiple tools, you lose visibility. If it lives in static diagrams, you lose context. That is why teams move toward interactive diagram environments that show signal flow and system behavior – not just component layout.
This is especially important in industries like for example automotive, aerospace, and energy. In automotive, systems must react in real time and integrate tightly with both software and hardware. In aerospace, even small logic errors can affect safety and certification processes. In energy and power systems, including BESS and grid infrastructure, engineers need full visibility to ensure stability and reliability.
Without a clear visual layer, it becomes difficult to understand how these systems behave under real conditions – and even harder to predict the impact of changes.
The most common challenges in managing and documenting control logic
Even experienced teams struggle with control logic when systems grow in scale. The problem is rarely the lack of tools. It is how those tools handle change, validation, and collaboration across the entire electrical system design.
In many organizations, visualization of electrical flow is still missing or limited. As a result, engineers work with partial views of the system, and their decisions rely on assumptions instead of clarity.
Below are the challenges that appear most often in modern industrial automation systems.
Static diagrams vs. dynamic workflows
Most teams still rely on static drawings like wiring diagrams or Single Line Diagram (SLD). They show structure well, but quickly lose value as the system evolves.
A static diagram captures one moment in time. It does not reflect how the system behaves after changes or integration. This creates a gap between documentation and reality. In practice, engineers often work with outdated diagrams. They compare versions (often the paper or PDF ones) and piece together, which slows decisions and increases risk of mistakes.
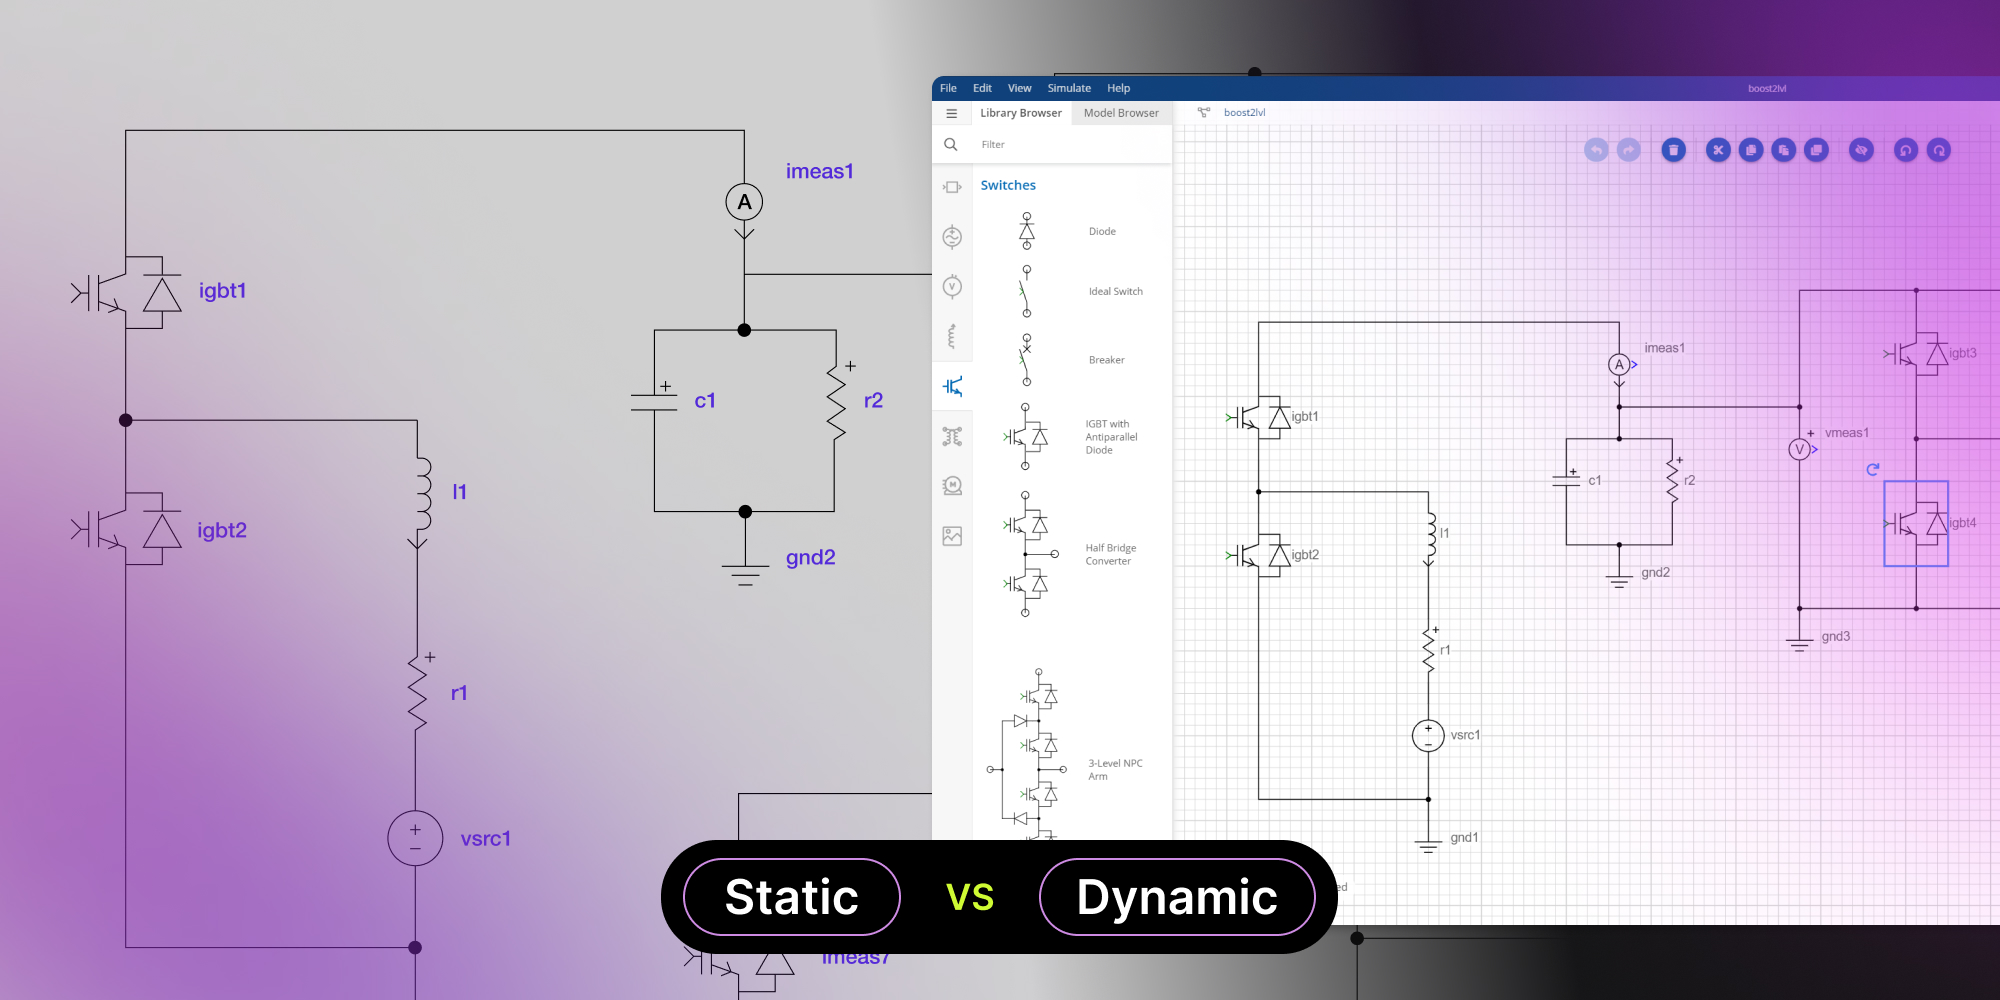
In comparison, dynamic visualization is a living system representation that updates automatically, keeping structure and behavior aligned. This is especially important in complex systems, where even small inconsistencies can cause serious problems.
Change management
Change is constant in any project. The real challenge is managing it across the entire system without creating confusion.
In traditional workflows, even small updates trigger multiple manual steps. Engineers update drawings, adjust documentation, and check dependencies across different tools. Each step increases the risk of inconsistency.
Over time, this leads to version chaos. Teams work on different versions, and key details can get lost between files and communication.
Validation – catching errors before they escalate
Validation is critical, but it often happens too late. Engineers finish the design first and verify it afterward, when fixes are already costly. Errors at this stage can delay delivery or impact safety, especially in complex environments.
Without visual support, validation relies on manual checks and experience. Engineers review diagrams and try to simulate behavior mentally, which increases the risk of missing issues.
Modern tools bring validation into the design phase. They highlight problems in real time and reduce rework. A functional diagram editor no longer just draws – it helps ensure correctness from the start.
Collaboration across teams
Complex systems require multiple teams to work together, but they typically operate in separate environments – and this creates friction. Information must be translated between tools and formats, which leads to misunderstandings.
However, visualization creates a shared view of the system. Engineers can work on details, while others understand the overall flow without diving into technical complexity. This improves communication and speeds up actions. It also reduces unnecessary back-and-forth. A clear visual interface makes the system easier to understand, even for non-technical users.
Quick comparison: static and dynamic electrical diagram editor
Examples of tools and solutions for control logic visualization
Choosing the right tool has a direct impact on how efficiently your team delivers projects. However, not every solution supports true visualization of electrical flow. Below is a practical overview of the most common approaches used in electrical system design – along with their strengths and limitations.
CAD
CAD tools remain a standard in electrical system design. They are widely used for creating detailed electrical drawings, wiring diagrams, and Single Line Diagram (SLD) documentation.
They work well when you need:
- Technical layouts,
- Standardized documentation,
- Compliance with industry formats.
Traditional CAD tools like AutoCAD Electrical focus on geometry and standardized documentation – they excel at technical layouts and compliance, but behavior modeling is outside their scope. Tools like EPLAN or Zuken go further with data-driven capabilities, yet they still operate within fixed, template-based logic.
What they don't offer is the flexibility to model custom system behavior or integrate seamlessly with external data sources like SCADA, IoT platforms, or ERP systems – which is where purpose-built editors make the difference. They may improve efficiency, but they do not provide a real view of how the system works or reacts to changes.
That is why many teams start looking for a CAD alternative – not to replace CAD entirely, but to extend it with more dynamic capabilities.
Custom schematic editors
Custom editors take a different approach. Instead of adapting generic tools, they are built to visualize system logic and behavior. Editor shows not only how components are connected, but also how the system actually works. You can follow signal flow, see dependencies, and get feedback while designing.
Most tools offer features like:
- Real-time feedback during design,
- Interactive diagrams that reflect system state,
- Reusable components aligned with your standards,
- Visual system modeling instead of manual drawing.
Many use a drag and drop editor, which makes them easy to use for both engineers and other team members. The biggest advantage is flexibility. The tool adapts to your workflow. Whether you work with control panel design, industrial control systems, or grid integration scenarios, the tool reflects your logic instead of forcing you into predefined structures.
Automation of electrical drawings
Automation is the next step beyond visualization. Instead of creating each electrical drawing manually, the system generates diagrams based on data and predefined logic.
In practice, this means:
- Bill of materials changes trigger automatic diagram updates,
- Component substitutions propagate across all affected drawings,
- Configuration variants, typical in automotive or energy projects, can be generated from a single parametric template rather than redrawn from scratch.
Teams using EPLAN or custom scripted workflows already apply parts of this logic; the difference with purpose-built solutions is that the entire pipeline, from configuration to documentation, is connected.
This approach is particularly useful in projects where similar systems are repeated or slightly modified – for example in industrial automation systems, energy infrastructure, or manufacturing setups.
Automation also connects diagrams with other parts of the workflow. A change in system configuration can immediately affect documentation, calculations, and even cost estimates. This reduces the need for manual synchronization and lowers the risk of inconsistencies.
How visual editors and automation work as one system
When a visual editor is combined with automation and aligned with a team's actual workflow, it changes how engineering projects are delivered.
Instead of adapting to generic software, engineers work with systems designed around their logic, their data, and their processes. The result is a solution where system behavior is clearly visible, while diagrams and documentation update automatically in the background.

This reduces manual work and keeps everything consistent across the entire environment. More importantly, it gives engineering teams full control over complex systems – without adding complexity.
Outdated electrical drawings cost teams 30% of project time.
Score your teamCase study – how OPAL-RT improved control logic visualization
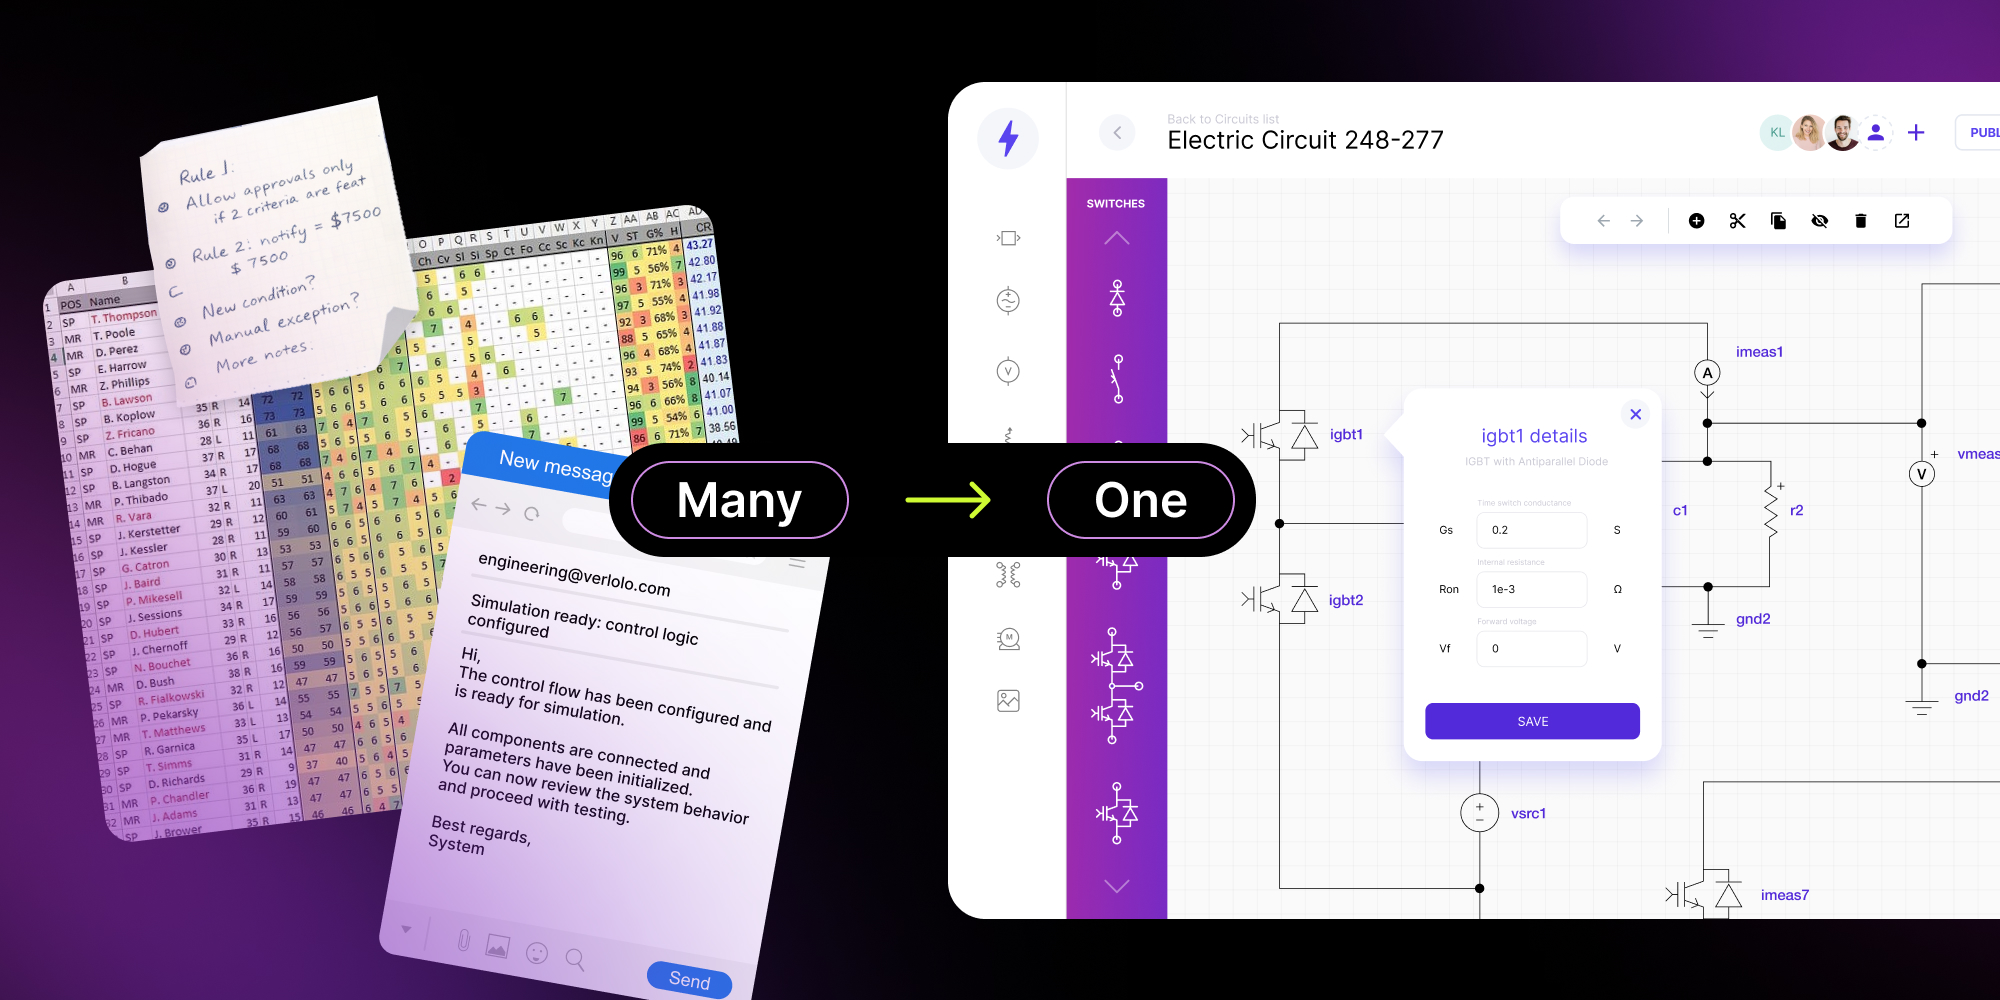
A global leader in real-time simulation and Hardware-in-the-Loop (HIL) testing needed to improve how automation engineers design and validate electric circuits. Their existing tools had limitations.
We built a custom schematic editor that enabled:
- Drag-and-drop modeling,
- Real-time signal validation,
- Reusable system components.
.jpg)
OPAL-RT engineers no longer redraw diagrams. They build systems visually and validate them instantly. This solution reduced manual work and improved how team understands control logic across the system.
→ Read the full case: Schematic Editor for intuitive electronics circuits modeling.
Benefits of control logic visualization – better communication, faster delivery, fewer errors
Better communication across teams
Real-time visualization gives every stakeholder the same view of the system. Instead of translating logic between tools and documents, you work on one shared file.
Key improvements:
- Clear view of how the system behaves – not just how it looks,
- Seamless collaboration between automation engineers, managers, and stakeholders,
- Easy to read representation of complex industrial automation systems
As a result, your electrical system design becomes easier to explain, review, and improve.
Faster delivery and shorter project cycles
Manual updates slow everything down. Static drawings require rework, especially when systems change frequently.
With dynamic signal flow visualization, teams speed up the entire workflow:
- Instant updates after changes in logic or data,
- Less time spent redrawing and synchronizing documentation,
- Faster iterations in system integration projects.
This allows your team to move from idea to implementation much faster.
Fewer errors and more reliable systems
Traditional workflows rely on late validation. By the time issues appear, fixing them is expensive.
With control logic visualization, problems become visible early:
- Real-time detection of invalid connections and logic gaps,
- Better consistency across the entire design,
- Reduced risk in critical industrial control systems.
Instead of fixing errors after deployment, you prevent them during design.
Better resource allocation
What changes in practice:
- Highly paid engineers spend less time on repetitive work
- More time goes into solving real engineering problems,
- Fewer delays and the ability to take on more projects.
Over time, automation becomes a competitive advantage – not just a technical improvement.
→ Want to know more benefits? Read the article: How CAD drawing automation speeds up sales and project delivery.
The role of automation and integration in modern visualization tools
Control logic visualization works best when combined with automation and integration.
Automation changes how electrical drawings are created. Instead of manual work, diagrams are generated from logic and data. When something changes, the system updates automatically, keeping the entire design consistent.
Integration connects visualization with tools like ERP, SCADA, IoT platforms, or simulation systems. In a well-integrated system, a change in a PLC tag, SCADA data point, or sensor state can automatically update the corresponding diagram element – no manual redraws required.
This kind of integration is built on standard protocols like OPC-UA, REST APIs, or direct database connections, depending on the environment. The result: engineers see system behavior in real time, not hours later after someone updates a static file.
Together, automation and integration turn visualization of electrical flow from a design feature into a core part of how your system operates.
Practical tips – how to choose the right tool and approach
When evaluating a tool, focus on what actually impacts your workflow:
- Real-time validation
The tool should detect errors during design, not after deployment.
- Easy integration
Make sure it connects with your existing tools (ERP, SCADA, databases).
- Scalability
It should handle growing complexity without performance issues.
- Clear, intuitive interface
A simple UI – ideally with a drag and drop editor – makes collaboration faster and easier.
- Automatic updates
Your system should apply updates automatically to reduce manual redraws.
Turn your control logic into a working system
Teams that still rely on static electrical drawings often spend too much time maintaining documentation. Dynamic signal flow visualization changes that. It helps engineers understand complex systems, reduce errors, and deliver faster across projects.
At Synergy Codes, we build custom solutions that turn diagrams into interactive systems – tailored to your logic, your data, and your workflows. If you want to see how this approach can work in your environment, book an engineering consultation.
- How does control logic visualization improve electrical system design?
It improves clarity across the entire electrical system design by making system behavior visible. Engineers can validate logic earlier, detect issues faster, and avoid costly rework. It also helps teams align around one shared view instead of working with disconnected tools.
- How does automation support control logic visualization?
Automation ensures that diagrams stay consistent with system logic and data. Instead of manually updating each electrical drawing, changes propagate automatically across the system. This reduces manual work and helps maintain a single source of truth.
- Is control logic visualization a replacement for CAD tools?
Not a replacement – an extension. Synergy Codes builds solutions on top of concepts engineers already know from CAD, but extends them far beyond static drawings. You get a familiar environment enhanced with real-time logic, automation, and integrations tailored to your company's workflows.
- Which industries benefit most from control logic visualization?
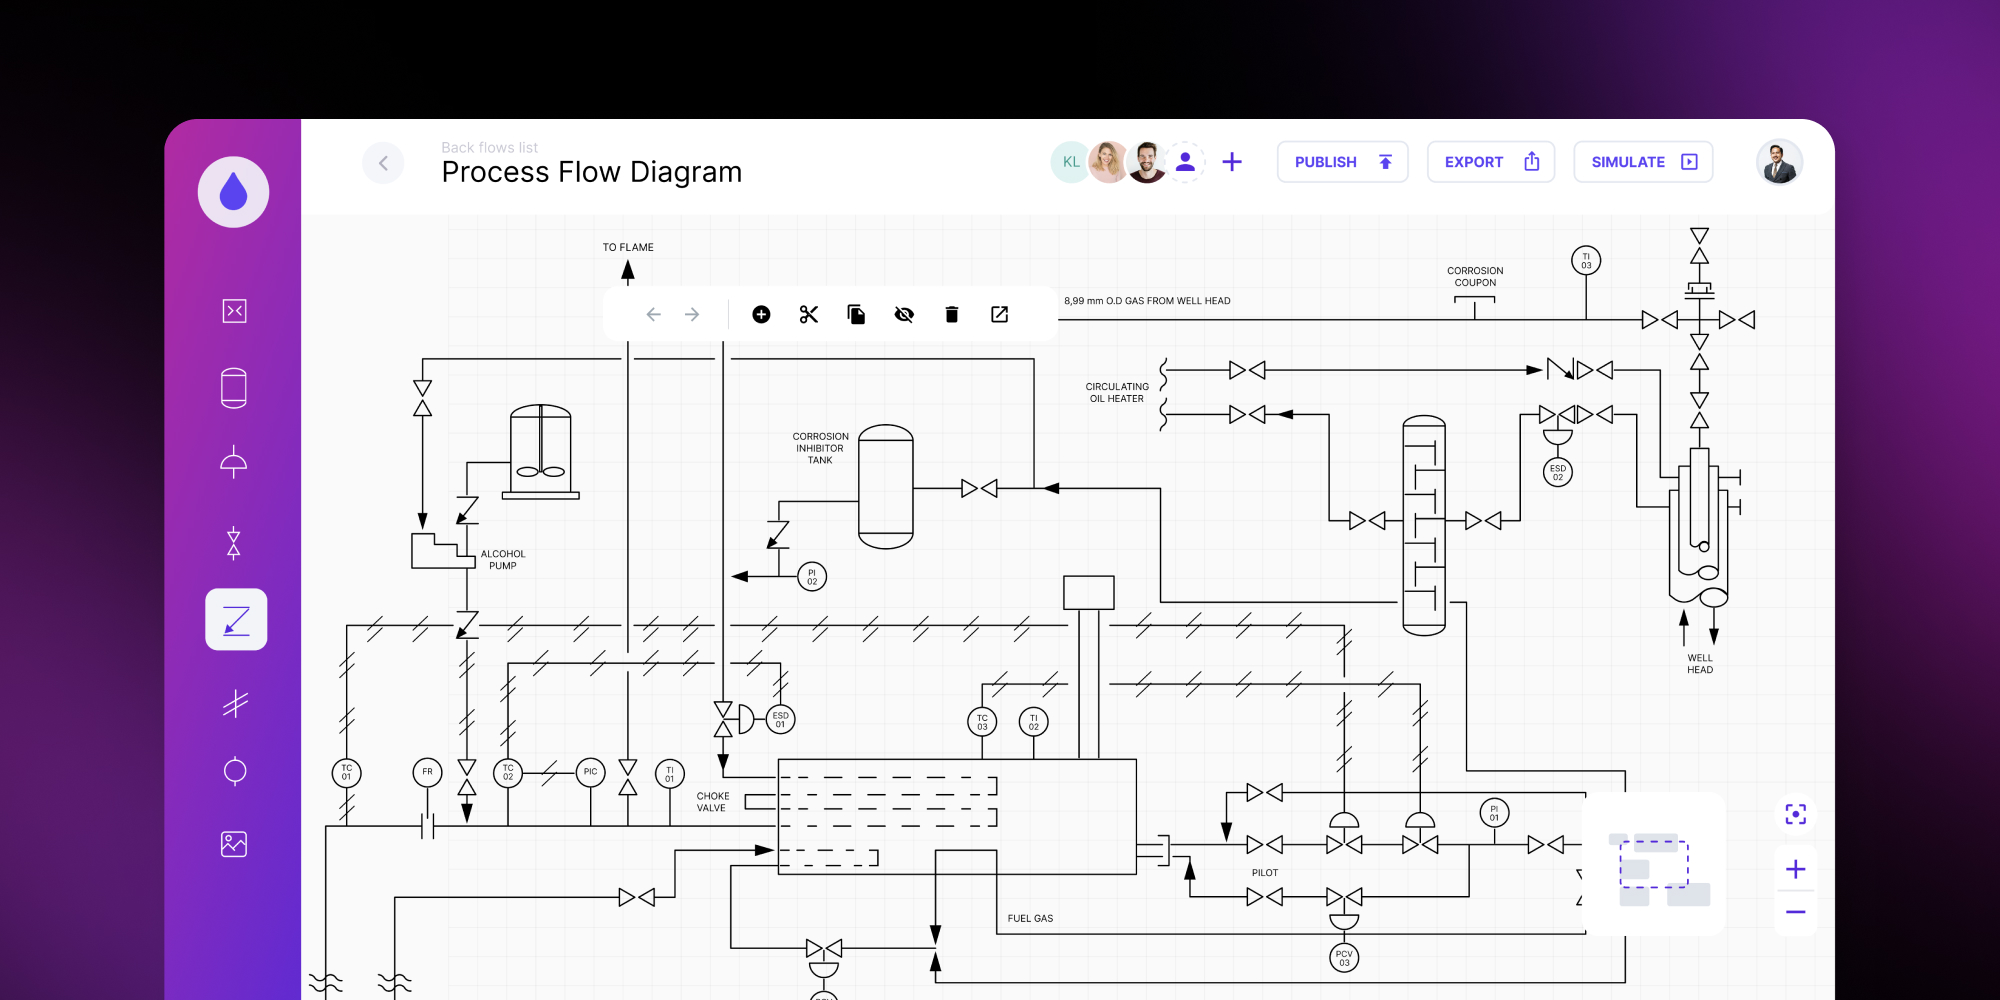
Industries with complex systems see the biggest impact – automotive, aerospace, energy, and industrial automation. In these environments, understanding dependencies and system behavior is critical for performance, safety, and scalability. Similar challenges appear in adjacent domains like P&ID systems, where visualizing system behavior is just as critical.
- How quickly can a custom visualization tool be deployed?
Implementation depends on scope and integration requirements, but a working prototype is usually ready within weeks rather than months. Teams typically start with one bottleneck – validation, drawing generation, or integration – and expand the platform from there.
- Can Synergy Codes build a custom control logic visualization platform for our team?
Yes. Synergy Codes designs purpose-built schematic and visualization tools using technologies like React Flow, GoJS, and ngDiagram – tailored to your standards, integrations, and engineering workflows.
Piotr started as a backend developer, but for five years, mainly associated with the frontend. He is involved in many corporate initiatives supporting process improvement. He manages the "Software Stack Diversity" Guild, which aims to recognize new technologies that enable the company's development in new areas. Piotr specializes in frontend architecture and the broadly understood software development process. Privately, he is passionate about photography, science, and his beloved wife and two kids.

Find how we can help you enhance your software and win more deals
Contact us to discuss your project. After you submit the form, we’ll get in touch with you within 48 hours to arrange a call.