
Shaping the future of data visualization

Explore cutting-edge ideas, case studies, and expert perspectives on designing visual solutions and leveraging AI for smarter decision-making.

An abstract visual showing the dissolving purpure and lime gradient-colored element.
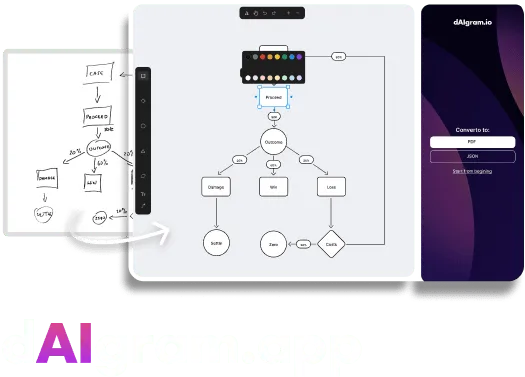
Hand-drawn flowchart transformed into a polished digital version.
Generate editable diagrams from pictures or screenshots

Convert any hand-drawn flowchart, whiteboard sketch, or screenshot of a diagram into a digital, editable format.

The artwork depicts an abstract design with large, curved shapes in gradient colors ranging from purple to yellow. The background is dark, and the shapes seem to overlap, creating a sense of depth and movement.
Featured
All articles

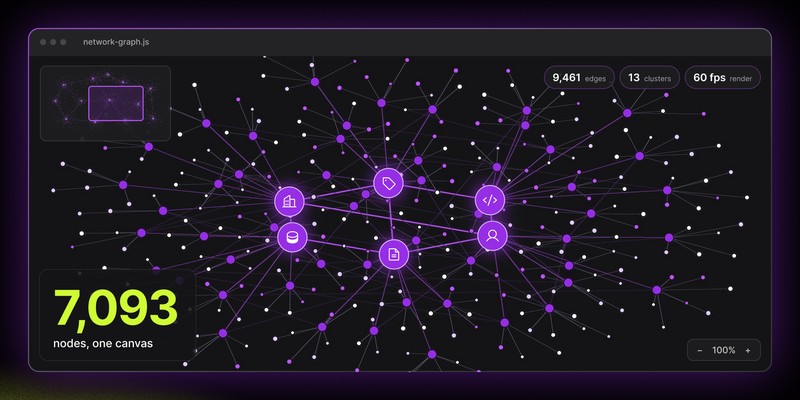
Large graph visualization in JavaScript: which libraries can handle thousands of nodes? 

A library that displays 20,000 lightweight points may still struggle with 2,000 complex nodes. Match the JavaScript graph library to your real workload. 

Ida Ożarowska
Nov 9, 2026

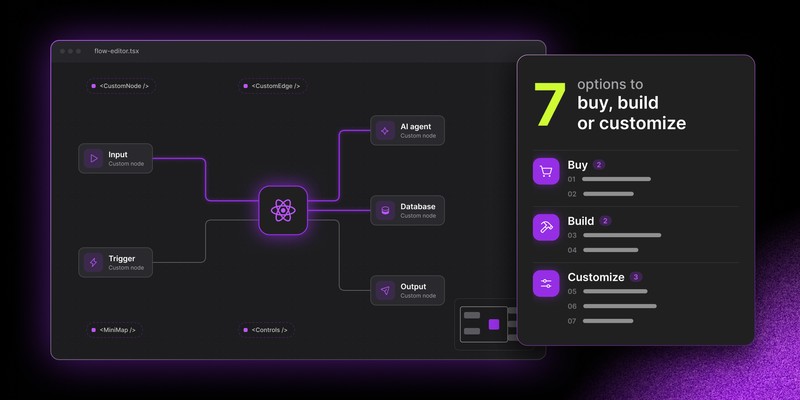
Production-ready React Flow components: 7 options 

React Flow gives you the canvas, but production editors also need toolbars, panels, layout, and keyboard UX. Here are 7 ways to fill that gap. 

Ida Ożarowska
Nov 8, 2026

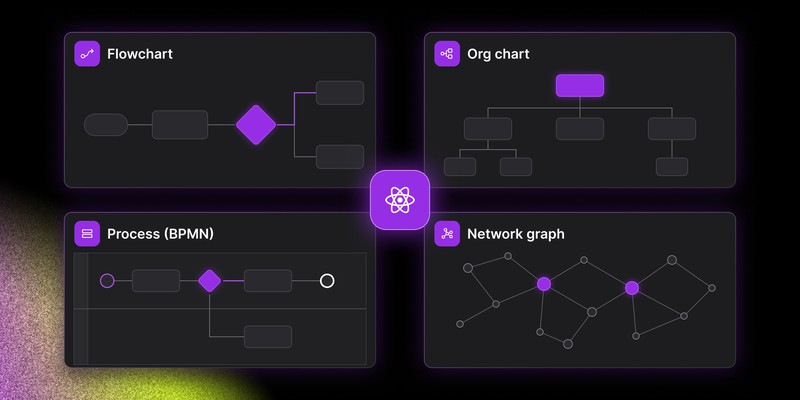
Best diagramming libraries for complex React applications 

Most React diagram libraries look alike in screenshots. The differences show up once your app needs real editing, larger diagrams, and collaboration. 

Ida Ożarowska
Nov 6, 2026

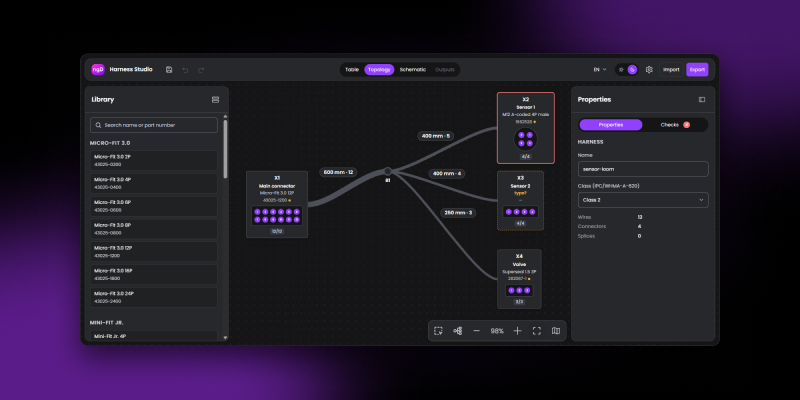
Custom wire harness design software: from Excel to editor

How we turned an Excel from-to list into browser-based wire harness design software in about 2 weeks, and why the domain took more work than the diagram.

Mateusz Jagodziński
Nov 4, 2026

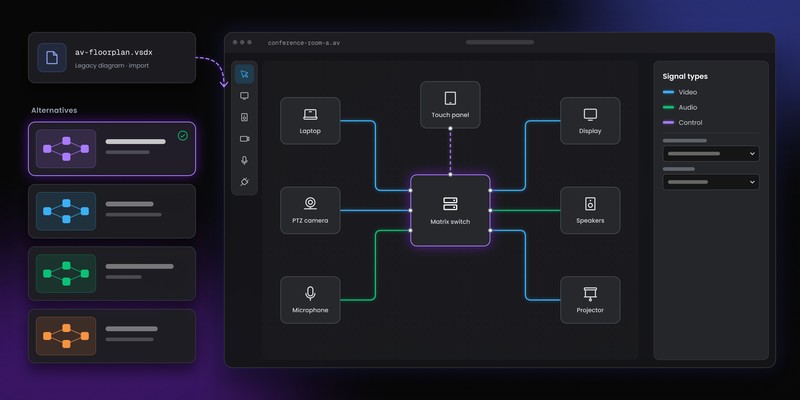
Best Visio alternatives for AV design teams in 2026

Visio handles basic AV diagrams but falls short once drawings must sync with equipment data, BOMs, and projects. See which of 7 alternatives fits your team.

Ida Ożarowska
Oct 8, 2026

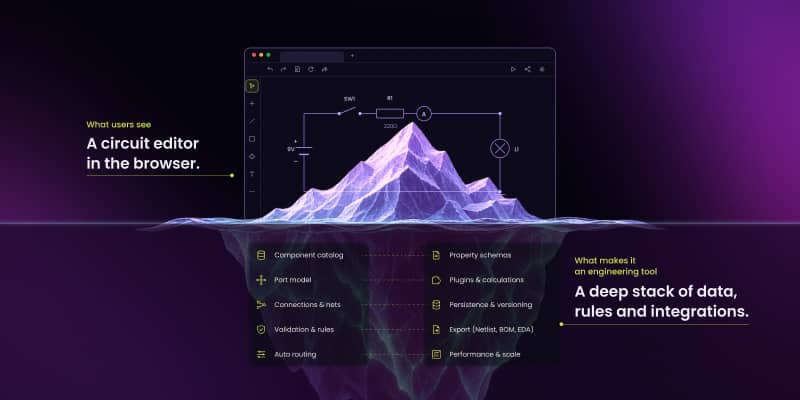
Web-based schematic editor: the hard parts

A canvas with symbols is the easy part. Pin identity, first-class nets, junction rules and grid routing decide whether a schematic editor survives production.

Maciej Teska
Aug 23, 2026

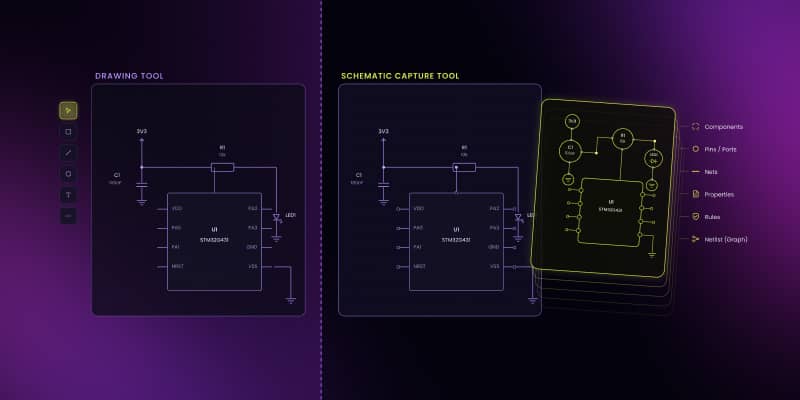
What is schematic capture (and why it's moving to the browser)

Schematic capture turns symbols and wires into a machine-readable circuit model. See what it contains and why concept-stage design is moving to the browser.

Maciej Teska
Aug 23, 2026

Large graph visualization in JavaScript: which libraries can handle thousands of nodes? 

A library that displays 20,000 lightweight points may still struggle with 2,000 complex nodes. Match the JavaScript graph library to your real workload. 

Ida Ożarowska
Nov 9, 2026

Production-ready React Flow components: 7 options 

React Flow gives you the canvas, but production editors also need toolbars, panels, layout, and keyboard UX. Here are 7 ways to fill that gap. 

Ida Ożarowska
Nov 8, 2026

Best diagramming libraries for complex React applications 

Most React diagram libraries look alike in screenshots. The differences show up once your app needs real editing, larger diagrams, and collaboration. 

Ida Ożarowska
Nov 6, 2026

Custom wire harness design software: from Excel to editor

How we turned an Excel from-to list into browser-based wire harness design software in about 2 weeks, and why the domain took more work than the diagram.

Mateusz Jagodziński
Nov 4, 2026

Best Visio alternatives for AV design teams in 2026

Visio handles basic AV diagrams but falls short once drawings must sync with equipment data, BOMs, and projects. See which of 7 alternatives fits your team.

Ida Ożarowska
Oct 8, 2026

Web-based schematic editor: the hard parts

A canvas with symbols is the easy part. Pin identity, first-class nets, junction rules and grid routing decide whether a schematic editor survives production.

Maciej Teska
Aug 23, 2026

Simple GoJS application: Setting and editing edges

Learn how to use ports in GoJS diagrams to customize edge connections, ensuring precise and interactive links between nodes.

Tomasz Świstak
Jun 13, 2018

How do I create a simple GoJS application?

Learn to build a basic GoJS diagram application with customizable nodes, dynamic templates, and interactive features in this step-by-step guide.

Tomasz Świstak
Jun 4, 2018

Real-time data visualizations with GoJS

Learn how GoJS enables real-time visualization for IoT systems, using dynamic diagrams and SignalR for interactive monitoring and control.

Content team
May 28, 2018

GoJS – easy data visualization

Discover how GoJS enables rapid creation of interactive diagrams for UML editing, process flows, and simulations, streamlining business visualizations.

Content team
May 10, 2018

Bug hunting and the search for perfection

See how a gamified “Bug Hunters” event uncovered 52 bugs, enhanced team skills, and ensured a flawless launch for a cutting-edge application.

Content team
Jan 22, 2018

How to recharge developers' batteries by letting them feel like real warriors - Autumn Trip 2016

From castle tours to military role-play, discover how an autumn retreat in the Izery Mountains sparked camaraderie and unforgettable moments.

Dec 7, 2016