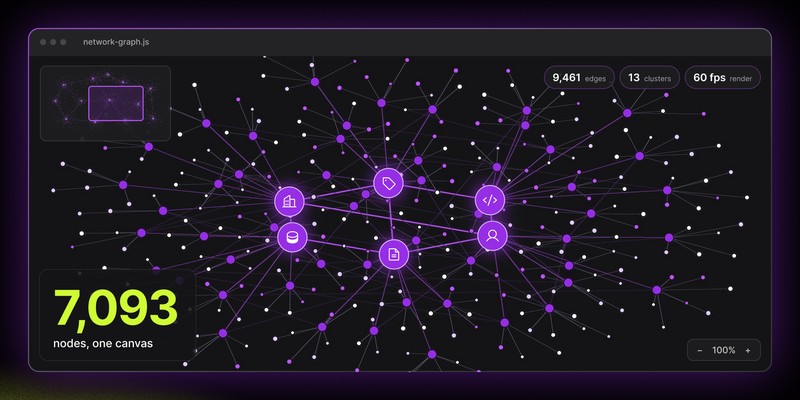

Large graph visualization in JavaScript: which libraries can handle thousands of nodes?
A library that displays 20,000 lightweight points may still struggle with 2,000 complex nodes. Match the JavaScript graph library to your real workload.
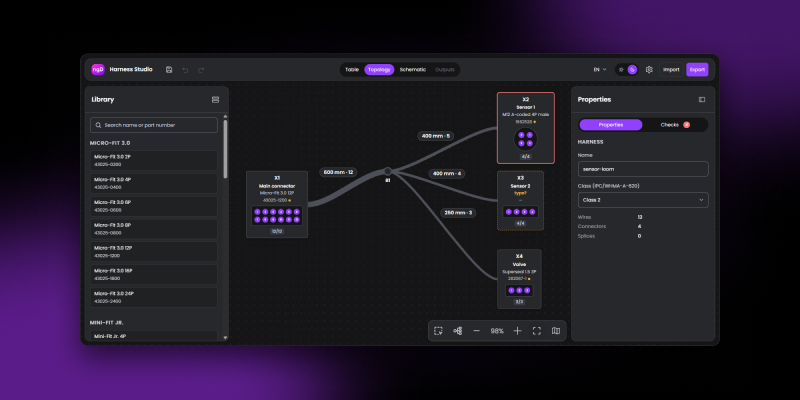
Custom wire harness design software: from Excel to editor
How we turned an Excel from-to list into browser-based wire harness design software in about 2 weeks, and why the domain took more work than the diagram.
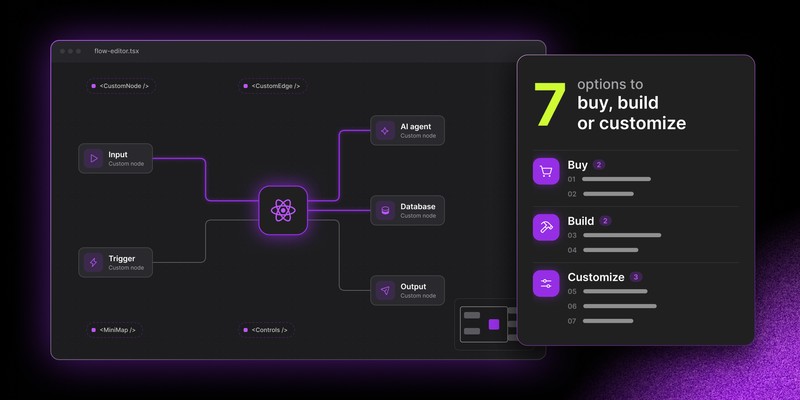
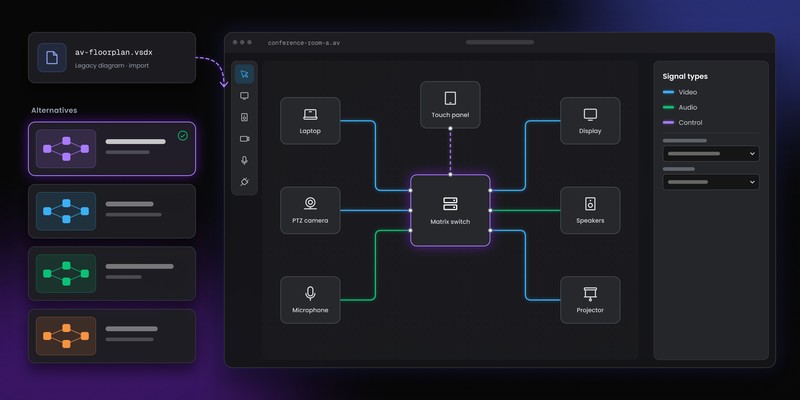
Best Visio alternatives for AV design teams in 2026
Visio handles basic AV diagrams but falls short once drawings must sync with equipment data, BOMs, and projects. See which of 7 alternatives fits your team.
Ida Ożarowska
Oct 8, 2026
Report
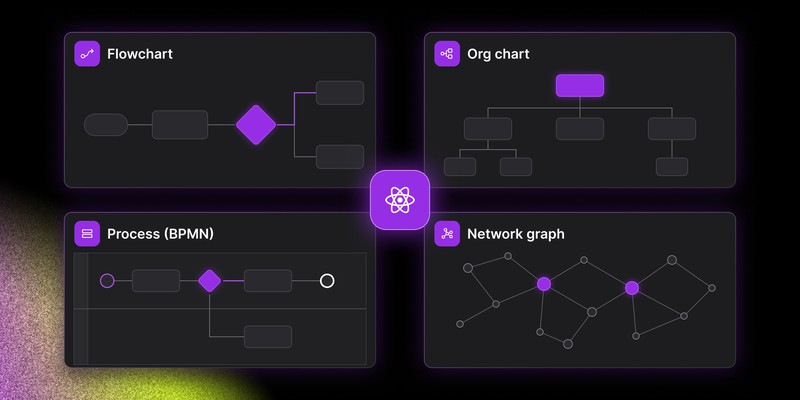
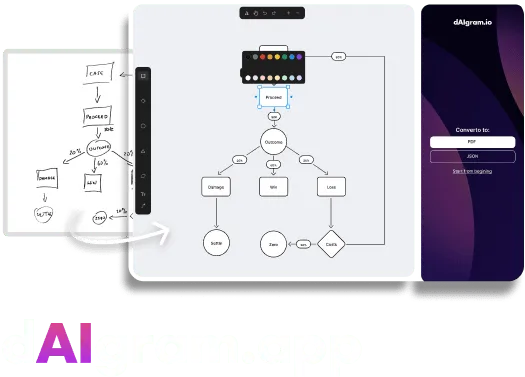
How AI shapes the future of data visualization?
Learn to navigate and leverage AI-driven solutions in data visualization. Meet trends and upcoming features that inspire industry experts.
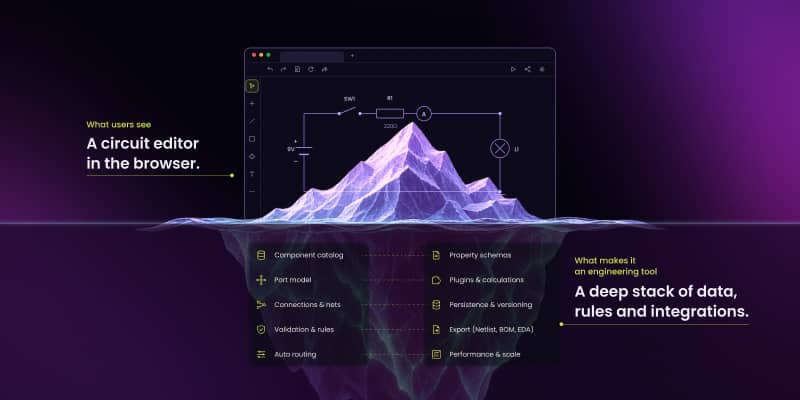
A canvas with symbols is the easy part. Pin identity, first-class nets, junction rules and grid routing decide whether a schematic editor survives production.
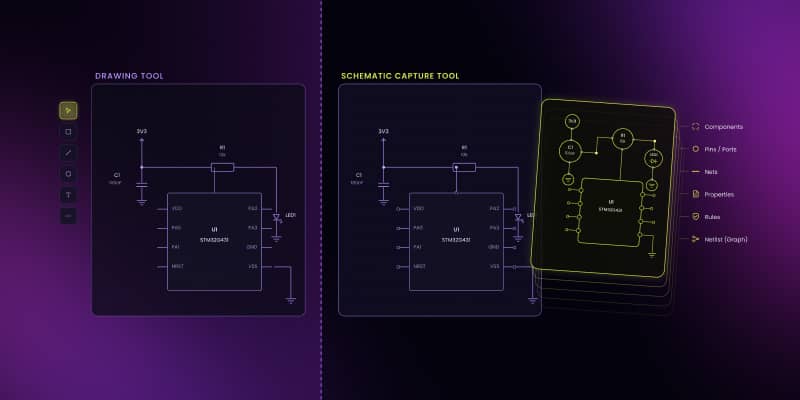
What is schematic capture (and why it's moving to the browser)
Schematic capture turns symbols and wires into a machine-readable circuit model. See what it contains and why concept-stage design is moving to the browser.
Maciej Teska
Aug 23, 2026
Be the first to know
Sign up for updates on our upcoming posts, products or services.
Thank you! Your submission has been received!
Oops! Something went wrong while submitting the form.
Large graph visualization in JavaScript: which libraries can handle thousands of nodes?
A library that displays 20,000 lightweight points may still struggle with 2,000 complex nodes. Match the JavaScript graph library to your real workload.
Custom wire harness design software: from Excel to editor
How we turned an Excel from-to list into browser-based wire harness design software in about 2 weeks, and why the domain took more work than the diagram.
Best Visio alternatives for AV design teams in 2026
Visio handles basic AV diagrams but falls short once drawings must sync with equipment data, BOMs, and projects. See which of 7 alternatives fits your team.
A canvas with symbols is the easy part. Pin identity, first-class nets, junction rules and grid routing decide whether a schematic editor survives production.
Discover how real-time data in diagrams boosts monitoring, reporting, quick responses, and collaboration, enhancing decision-making and project efficiency.
Front-end solutions in IoT. A new trend or pipe dreams? Let’s find out!
Explore how the IoT industry is embracing front-end solutions, with a focus on user-friendly visualizations that drive decision-making and enhance usability.
Discover how the challenges of 2020 led Synergy Codes to embrace growth opportunities, expand into new markets, and refine strategies for success in 2021.
4 steps to optimize the project with full control and live cooperation
Optimize your projects with tools that enable task logic, real-time tracking, streamlined communication, and multi-functional capabilities for full efficiency.